U.S. retail market insights for the plant-based industry
Explore our analysis of U.S. retail sales data for plant-based meat, dairy, eggs, and more, including category insights, size, growth, and purchase dynamics for the market.
The plant-based food industry is evolving
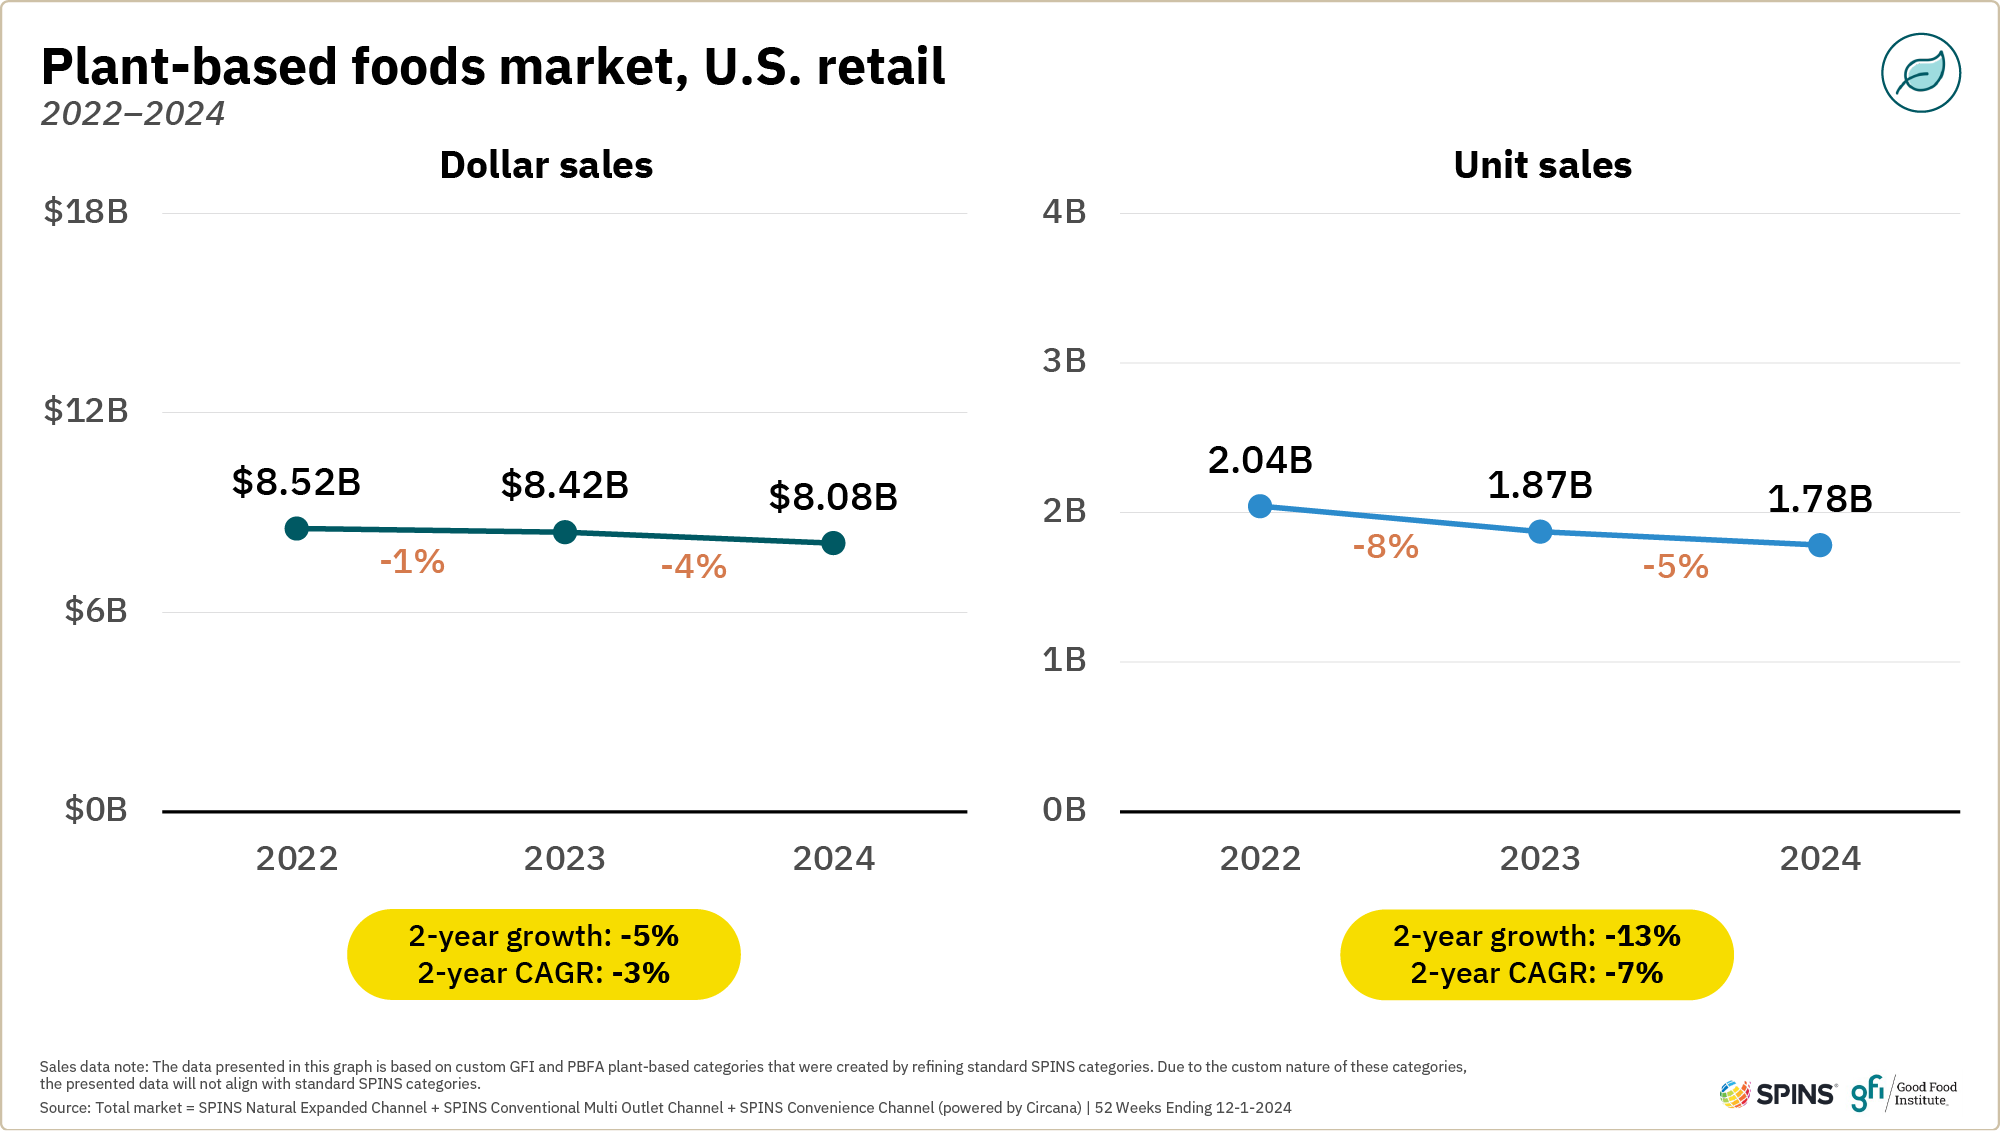
The U.S. plant-based food industry has grown and evolved substantially over the past decade. When we began tracking plant-based food sales in U.S. retail, we sized the 2017 market at $3.9 billion, according to SPINS data. In 2024, the market was worth $8.1 billion.
Innovation and investment have driven a decade of strong growth
Much of the growth in the plant-based food market over the past decade has been driven by products that appeal to mainstream consumers by seeking to replicate the taste, texture, and functionality of conventional animal products. Companies, from startups to large food manufacturers, generated that growth through significant innovation and investment in their plant-based portfolios. Consumers have more options than ever when selecting plant-based meat and seafood, egg, and dairy products that can be swapped in for their conventional counterparts, as well as other plant-based foods. Many plant-based categories increasingly make up notable shares of their respective overall categories.
Exploring the sales trends in this market reveals the industry’s progress toward achieving consumer adoption of plant-based foods at the scale needed to realize their real-world environmental, public health, and animal welfare advantages over their conventional counterparts. To that end, GFI carefully tracks these evolving metrics as part of our ongoing work to develop the roadmap for a more sustainable, secure, and just protein supply.
Challenging market signals
Against this backdrop of long-term progress, recent years have been characterized by a more challenging market environment. Following the rapid expansion of the U.S. plant-based retail market from 2019 to 2021, sales moderated in 2022 and declined in 2023 and 2024. Plant-based price increases coincided with elevated inflation and tight consumer budgets, and purchase dynamics indicated weakening consumer engagement in plant-based categories. There are additional signals that, for the market to see sustained growth, products will need to better deliver on the key consumer drivers of taste, price, and convenience, while offering clear propositions to entice consumers to make the switch.
These are solvable challenges
These are solvable challenges. Recent setbacks are against a backdrop of high potential. Currently, taste and price performance and lack of a broadly compelling value proposition are limiting the category’s engagement with consumers. For plant-based meat, many U.S. consumers say they’d be more willing to eat it (more) if it tasted better and were more affordable. This underscores the opportunity for brands to innovate to improve the eating experience of their products. Companies and retailers can work to lower prices. The industry can collaborate to communicate to consumers the unique value their products provide. To create sustained, long-term growth, stakeholders must take action to better meet consumer needs and return plant-based foods to sustainable growth.
Note: The data used in this report, unless otherwise noted, is based on SPINS plant-based positioned and/or labeled vegan attribution, with the additional inclusion of plant-based private-label products. Due to the nature of these categories, the presented data may not align with standard SPINS categories. Read more about our methodology.
We’ve summarized highlights from the data to help characterize the U.S. retail plant-based food industry. We cover both the plant-based food market as a whole and key plant-based categories like meat and milk.
Plant-based foods are an $8.1 billion market in U.S. retail
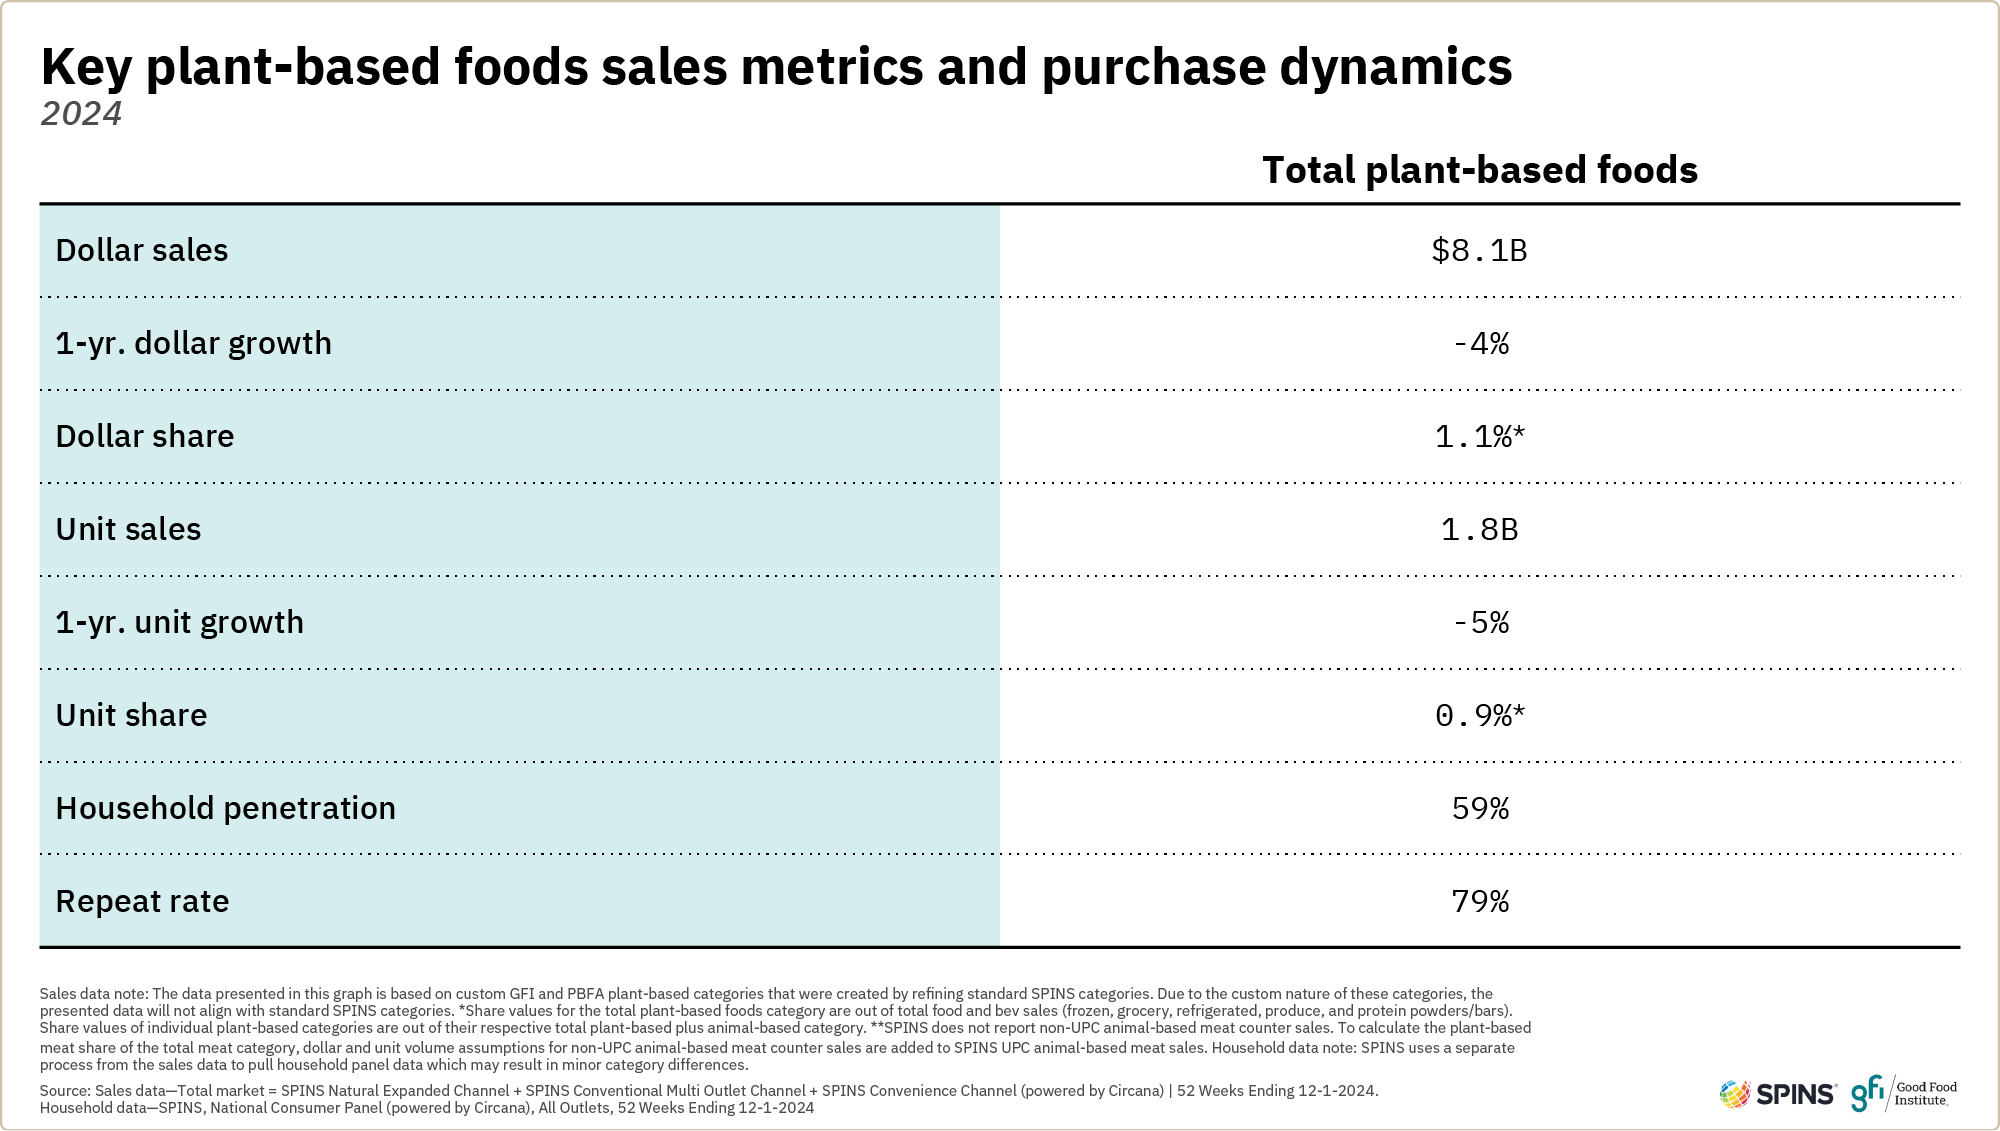
Insights released by the Good Food Institute (GFI) and the Plant Based Foods Association (PBFA) based on retail sales data commissioned from SPINS show that the 2024 U.S. retail plant-based food market was worth $8.1 billion. Plant-based unit sales were down five percent from 2023, while dollars were down four percent.

The U.S. retail market for plant-based foods is worth $8.1 billion.
59% of U.S. households purchased plant-based foods in 2024, similar to the prior year.
Plant-based foods made up 1.1% of total retail food and beverage dollar sales in 2024.
96% of households that bought plant-based meat and seafood in 2024 also bought animal-based meat.
Performance varied across plant-based food categories tracked in this dataset in 2024.
- Sales of the largest categories – plant-based milk and plant-based-meat and seafood – declined
- Some categories saw meaningful sales growth, including plant-based protein powders and liquids, bars, ready-to-drink beverages, tofu, tempeh, and seitan, baked goods, and other desserts.
The total food and beverage category was relatively stable in retail in 2024. Unit sales were flat while dollars grew two percent, driven by price increases. Conventional meat and seafood unit sales grew three percent while dollar sales grew four percent. Conventional milk dollar sales grew one percent while units were flat. Most other conventional dairy categories experienced growth.
Consumer price sensitivity continues to impact the market
While overall food and beverage sales stabilized in 2024, this was amidst a backdrop of continued consumer price sensitivity driven by concern and frustration about grocery costs following several years of inflation. Average prices of plant-based products often far exceed those of their conventional counterparts, making the switching proposition less appealing for consumers. Plant-based meat and dairy are regularly two to four times more expensive pound for pound (or gallon for gallon) compared to conventional meat and dairy. Average plant-based meat and seafood prices are up 13 percent over the past two years, while average conventional meat and seafood prices are up only four percent. Similarly, average plant-based milk prices are up eight percent over the past two years, while average conventional milk prices are up only two percent.
Underscoring the impact of consumer price sensitivity on the plant-based foods category, research by Kroger, the Plant Based Foods Institute, and 84.51° found that 28 percent of Kroger shoppers who cut back on plant-based foods between 2023 and 2024 said the products no longer fit their budgets, up 12 percentage points over the previous year. Additionally, 23 percent cited the fact that these products had been on sale or promo less often, up 12 percent over the previous year. A 2024 study by the International Food Information Council found that 90 percent of Americans noticed an increase in the cost of foods and beverages in 2024 (compared to 83 percent in 2022). Among those consumers, half said they frequently chose new products or brands due to high costs and one in four said they made less healthy food choices. It is clear that despite easing inflation, consumers continue to find it challenging to afford these premium-priced products.
Opportunities to adapt to evolving consumer needs
Recent years represent a challenging moment for plant-based foods in U.S. retail. Many consumers have unmet expectations and needs. For plant-based meat specifically, a 2023 report from Mintel indicates that over a quarter of all U.S. consumers are lapsed plant-based meat purchasers, meaning they purchased plant-based meat products in the past but did not do so in the most recent three months. One bright spot is that many consumers are open to trying or returning to the category.
A study conducted by GFI in 2024 found almost three-quarters of U.S. consumers aged 18 to 59 are open to consuming plant-based meat and/or plant-based dairy in the future. However, it’s clear that making progress on taste and price is critical to appeal to consumers considering plant-based foods. More than a third of consumers said that plant-based meat being more affordable is a top factor that would make them consider it more. Over a quarter said they would be more likely to consider plant-based meat if it tasted more like conventional meat. Other benefits like health, sustainability, and animal welfare are also important components of the value proposition for various segments of consumers. Across other plant-based categories, price and taste similarly rise to the top among factors impacting trial and repeat purchase.
Outlook: Signals and opportunities
Despite these challenges, there are important tailwinds in the plant-based foods sector.
- There is substantial consumer aspiration to reduce meat intake and increase plant-based food consumption. Roughly 33% of U.S. adults who eat meat and poultry report actively trying to reduce their meat and poultry intake. Additionally, almost three-quarters of U.S. consumers aged 18 to 59 say they are open to consuming plant-based meat and/or plant-based dairy in the future. Within this group, several segments of consumers demonstrate high levels of engagement with plant-based foods and present attractive near-term opportunities to grow the market.
- There’s an enormous potential market for plant-based foods. In U.S. retail, annual conventional meat sales are over $100 billion and conventional milk sales are $17 billion, according to SPINS. Plant-based foods that can meet consumer needs around taste and affordability and provide a compelling value proposition have large market potential. Today, 96% of households buying plant-based meat and seafood already purchase conventional meat. The most engaged plant-based meat and seafood-purchasing households are spending up to a third of their total meat purchases on plant-based meat and seafood (based on a migration study GFI commissioned from NielsenIQ).
- The price gap remains a substantial barrier—and closing it could help spur uptake. Today, plant-based products sell at per-pound, per-gallon, or per-dozen prices up to two times more expensive than their conventional counterparts. Research over the past couple years has found consumers increasingly likely to say price is the reason they are not buying (or buying less) plant-based foods. Among consumers who have eaten plant-based meat previously but not in the past year, 35% say they would repurchase if the price was lower than conventional meat.
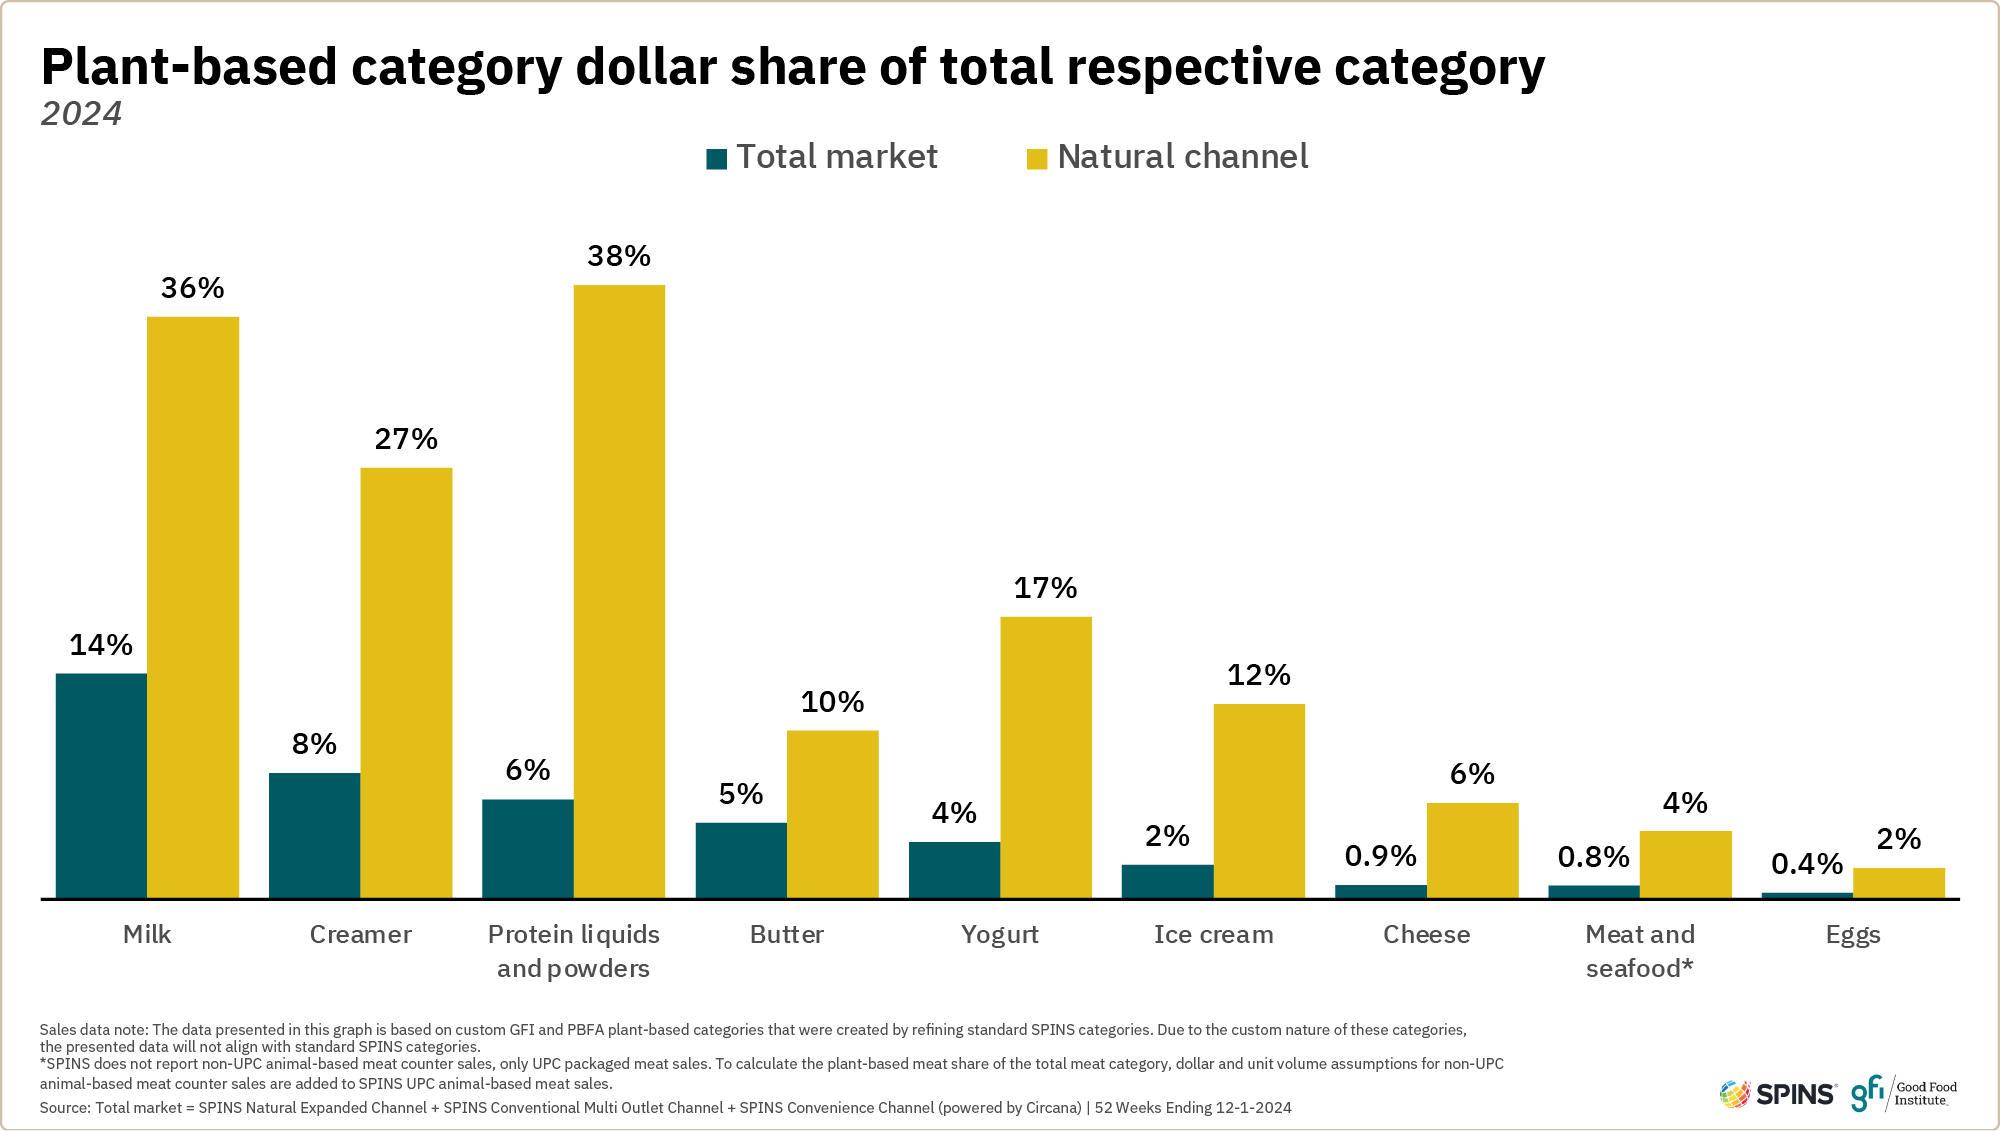
- Taste and texture progress is one of the main drivers of plant-based foods’ emergence over the past decade—and there’s more work to be done. Providing a substitutable product for conventional milk and merchandising it in the refrigerated milk set to appeal to omnivore consumers drove plant-based milk’s rise to represent about 14% of fluid milk dollar sales, according to SPINS. In the last few years, plant-based meat products that taste and look like conventional meat have come to represent the majority of the plant-based meat category. Some subcategories of plant-based meat even appear to be nearing sensory parity with conventional meat. Notably, recent studies show plant-based chicken nuggets have likability scores comparable to conventional nuggets. Yet gaps remain for many subcategories, and consumers still identify taste as a top barrier to purchasing plant-based meat. Among consumers who have eaten plant-based meat previously but not in the past year, 36% say they would repurchase if the taste and texture were exactly like conventional meat.
There is consumer interest in buying plant-based alternatives to these staple products found in nearly every U.S. home. For these alternatives to become everyday options, milestones on taste and price must be met and a compelling value proposition for switching must be delivered.
Summarizing plant-based food market sales data
Overview
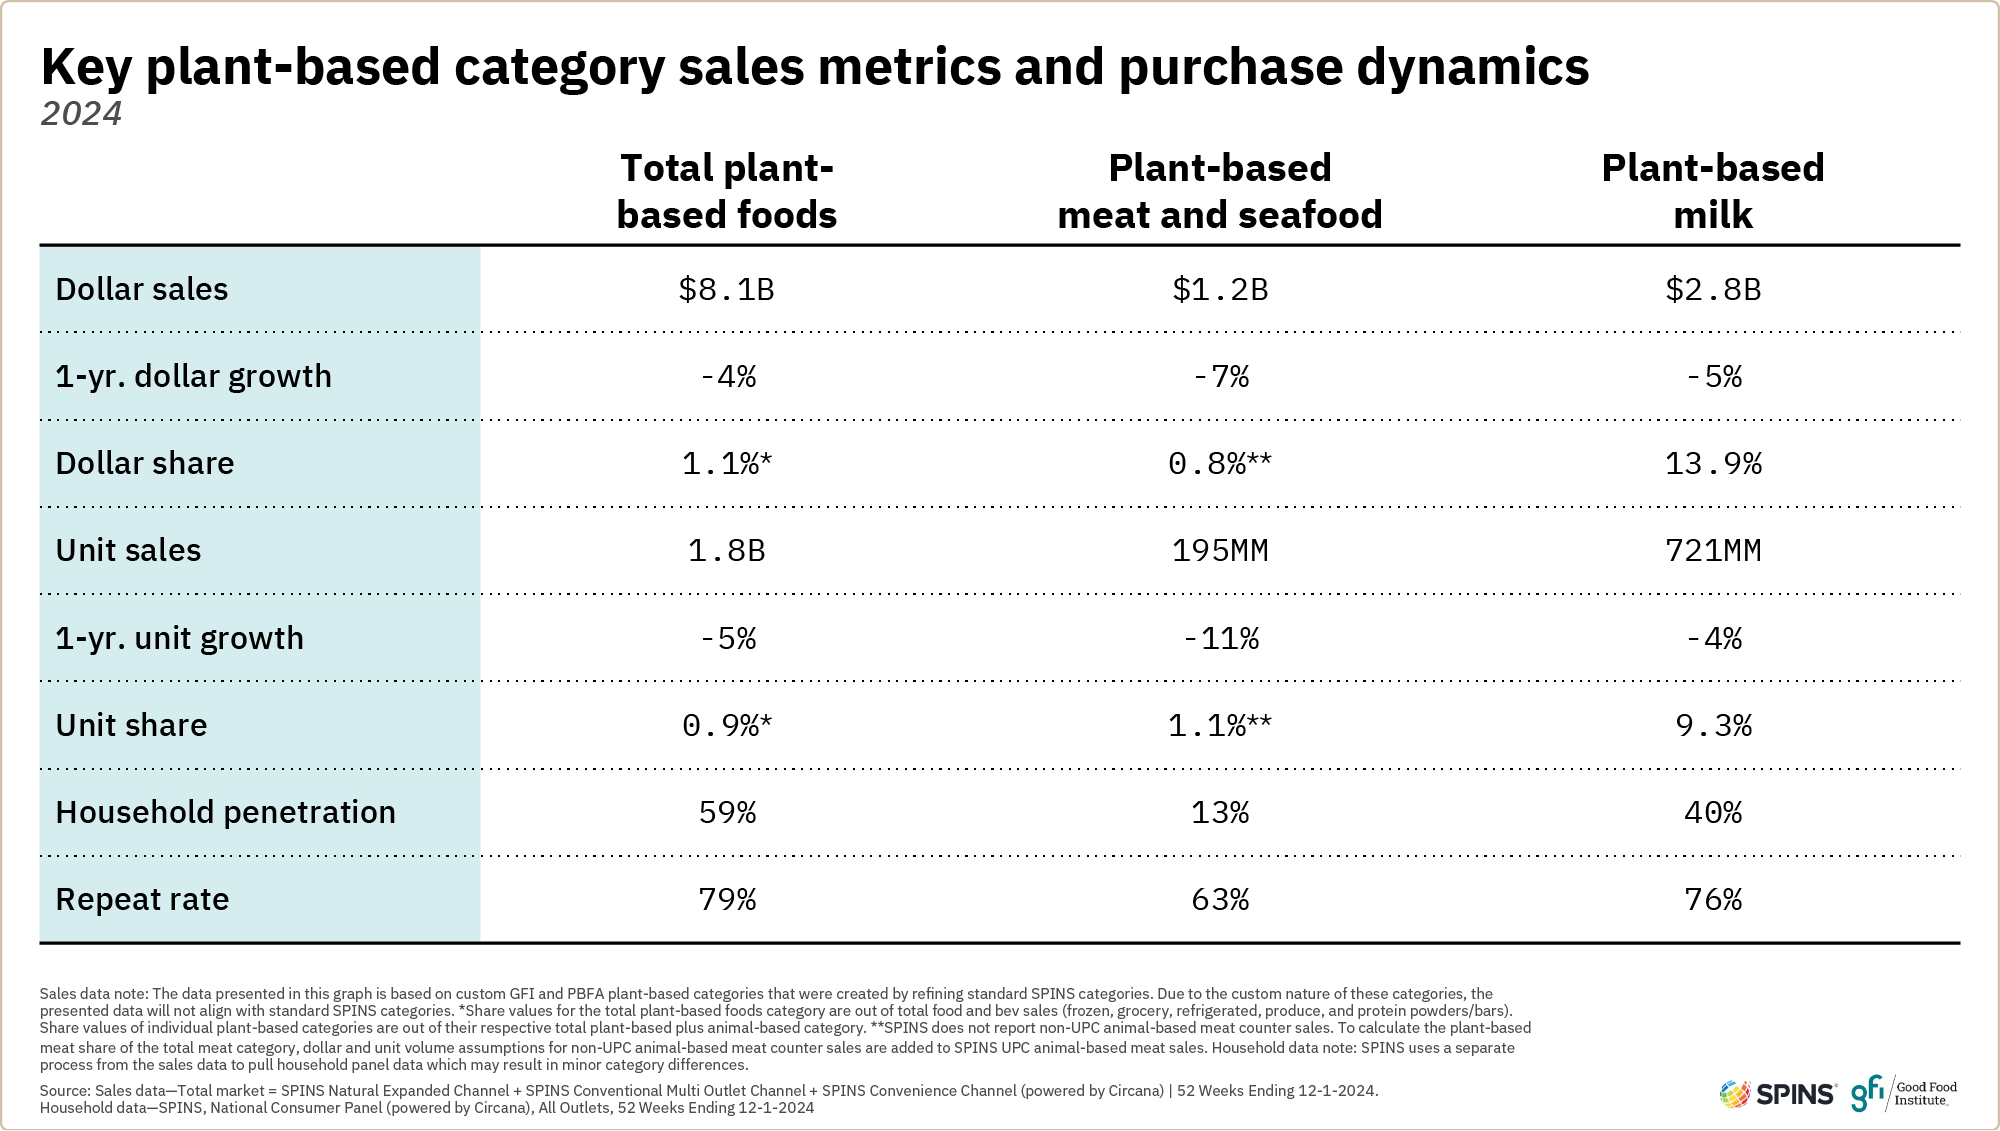
According to SPINS, in 2024, total plant-based food dollar sales declined four percent while unit sales declined five percent. Six in 10 U.S. households purchased plant-based foods and 79% of those purchased more than once, similar to the prior year.
In the natural channel, which is often on the leading edge of change in the retail sector, plant-based food sales were more stable in 2024. Dollar sales increased two percent and unit sales declined slightly by one percent, an improvement over the eight percent unit sales decline experienced in 2023.
Distribution losses appeared to drive sales declines in the plant-based foods market. However, both dollar and unit velocities were up overall in both the conventional multi outlet (MULO) and natural channels, a possible indication of improved assortments. Plant-based milk was a notable exception, seeing distribution gains in 2024 but declining dollar and unit velocities.
The total food and beverage category was relatively stable in 2024. Unit sales were flat while dollars grew two percent, driven by an average retail price increase of two percent. Average prices per unit increased only slightly for plant-based foods, up one percent in 2024 compared to an eight percent increase in 2023.
Categories
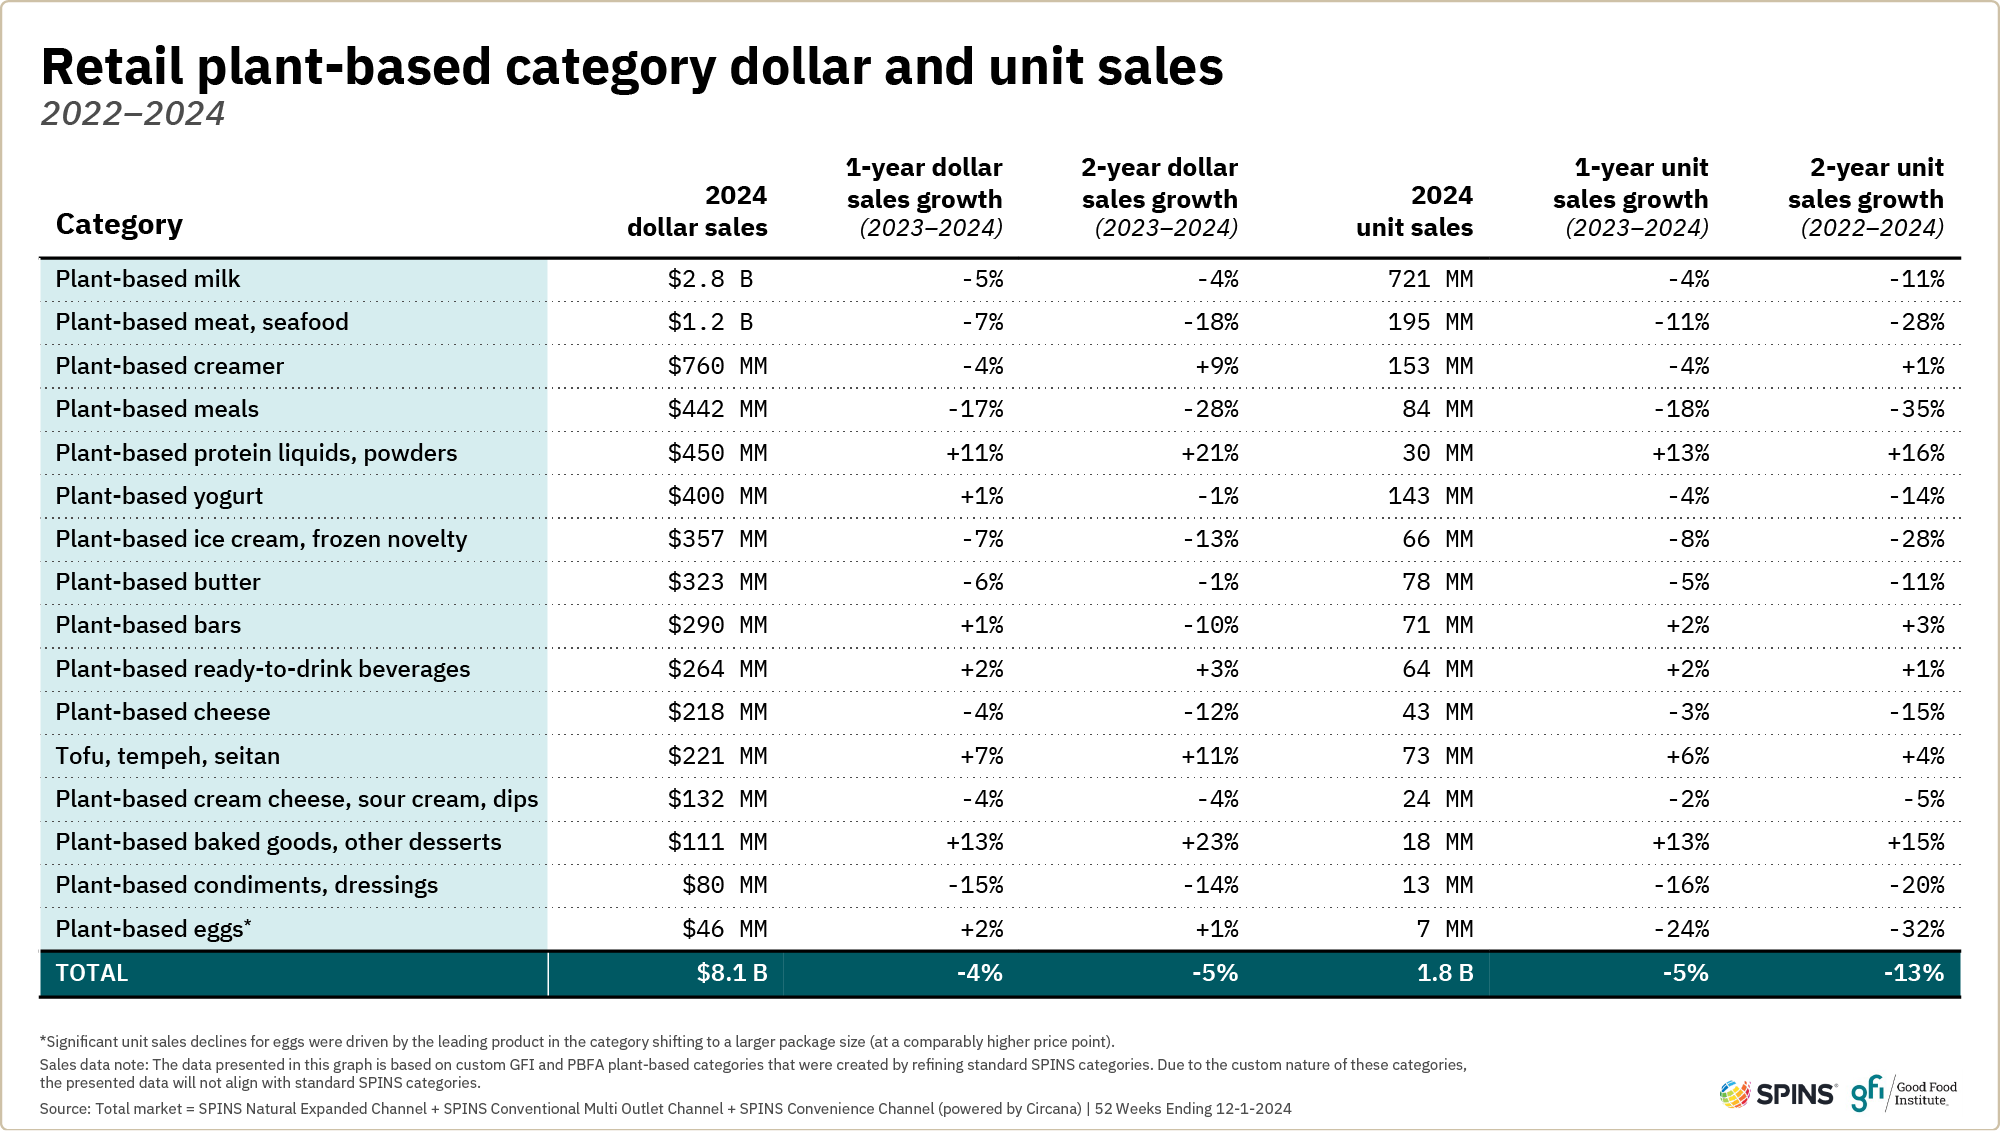
Plant-based food categories exist in various stages of development. Sales declined across many categories in 2024 but some experienced growth.
- Plant-based milk is the most developed of all plant-based categories. Plant-based milk dollar sales decreased by 5% to $2.8 billion in 2024. Unit declines were slightly less as average prices dropped 1%. Plant-based milk maintained about a 14% share of total milk dollar sales.
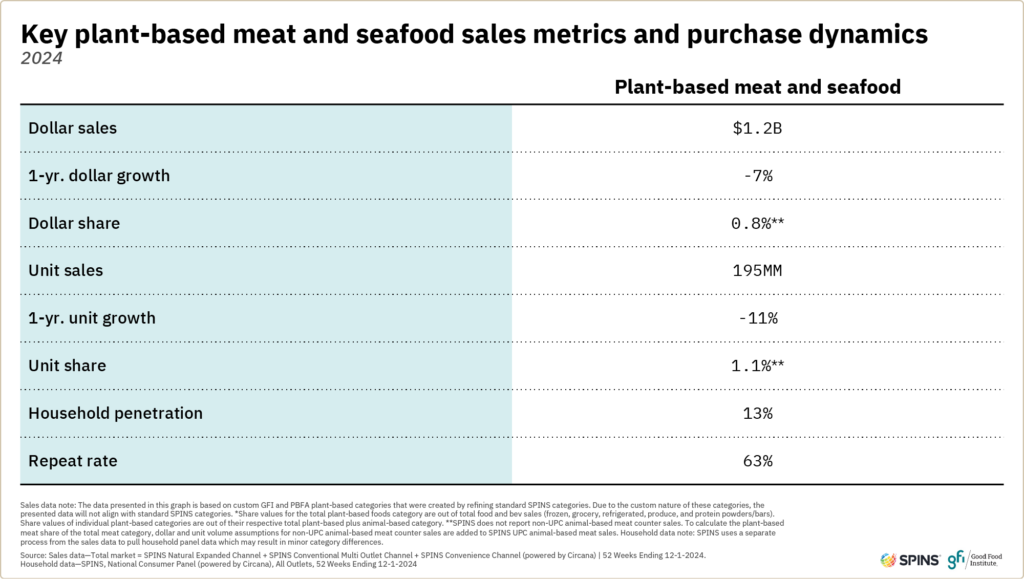
- Plant-based meat and seafood dollar and unit sales fell for the third straight year. Dollar sales for plant-based meat and seafood were $1.2B in 2024, down 7% from 2023. However, the rate of decline was slower than seen in 2023.
- A few plant-based categories experienced meaningful growth. Most notably, plant-based protein liquids and powders and baked goods and other desserts experienced double-digit dollar and unit sales increases. Tofu, tempeh, and seitan also experienced strong growth.
- The emerging category of plant-based eggs saw modest dollar growth. Sales were up 2% in 2024. Unit sales were artificially driven down (and average prices driven up) by pack size increases for the top-selling product in the category.
- Retail prices stabilized for most plant-based categories. After significant growth in average retail prices across plant-based categories in 2023, average prices for most categories grew or declined only 1% to 2% in 2024. However, prices remained significantly higher than conventional counterparts.
Overall consumer demographics
Plant-based food category purchases are more likely among select consumer demographics. Relative to the average household, purchasers of plant-based foods tend to be younger (particularly Millenials), come from higher-income households, and have graduate degrees. Asian American consumers are also more likely to be buyers of plant-based foods.
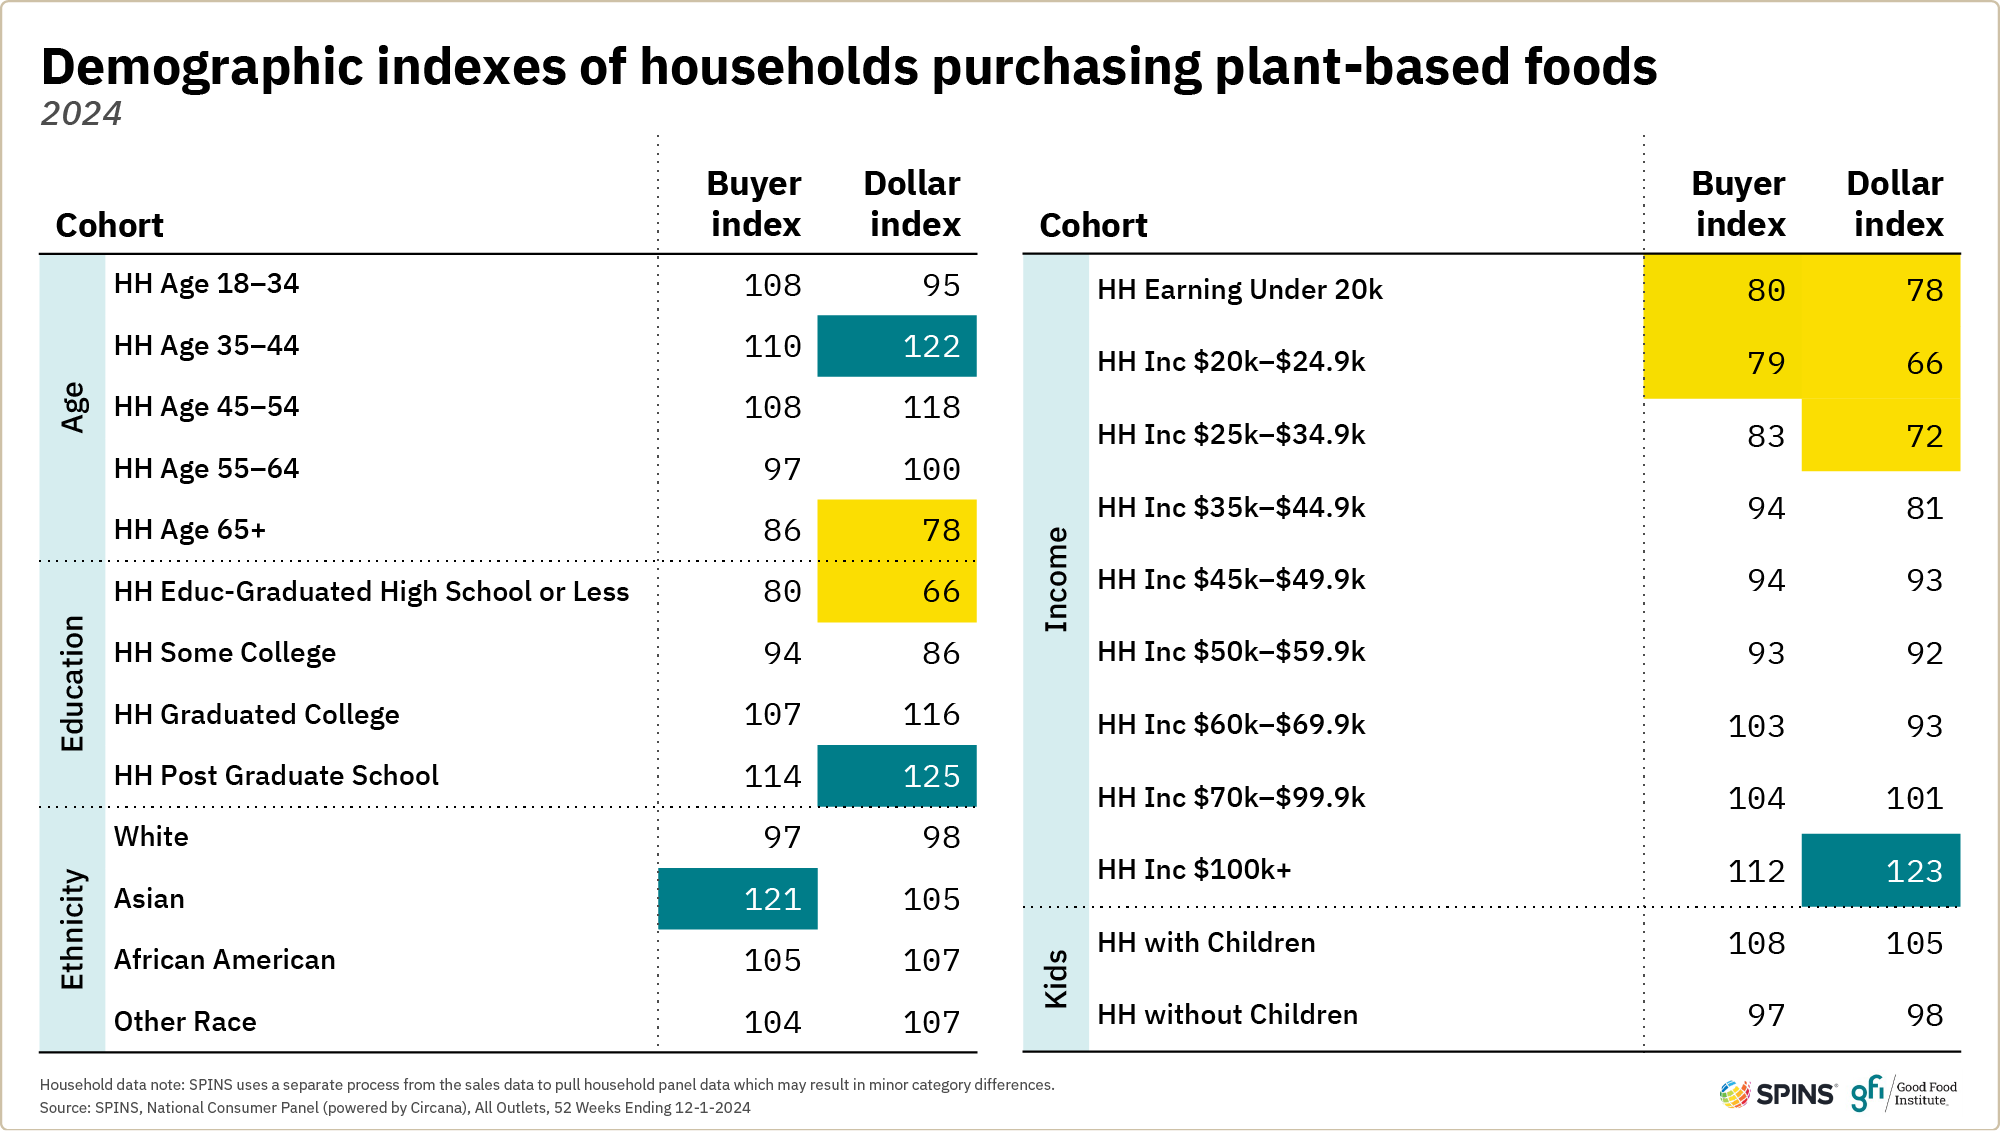
Note: Buyer index indicates if a certain group is more or less likely to purchase in the category compared to the average household. Dollar index indicates the extent to which a certain groups spends more or fewer dollars in the category compared to the average household. A value of 120 or more indicates over-indexing and a value of 80 or less indicates under-indexing.
Price gap
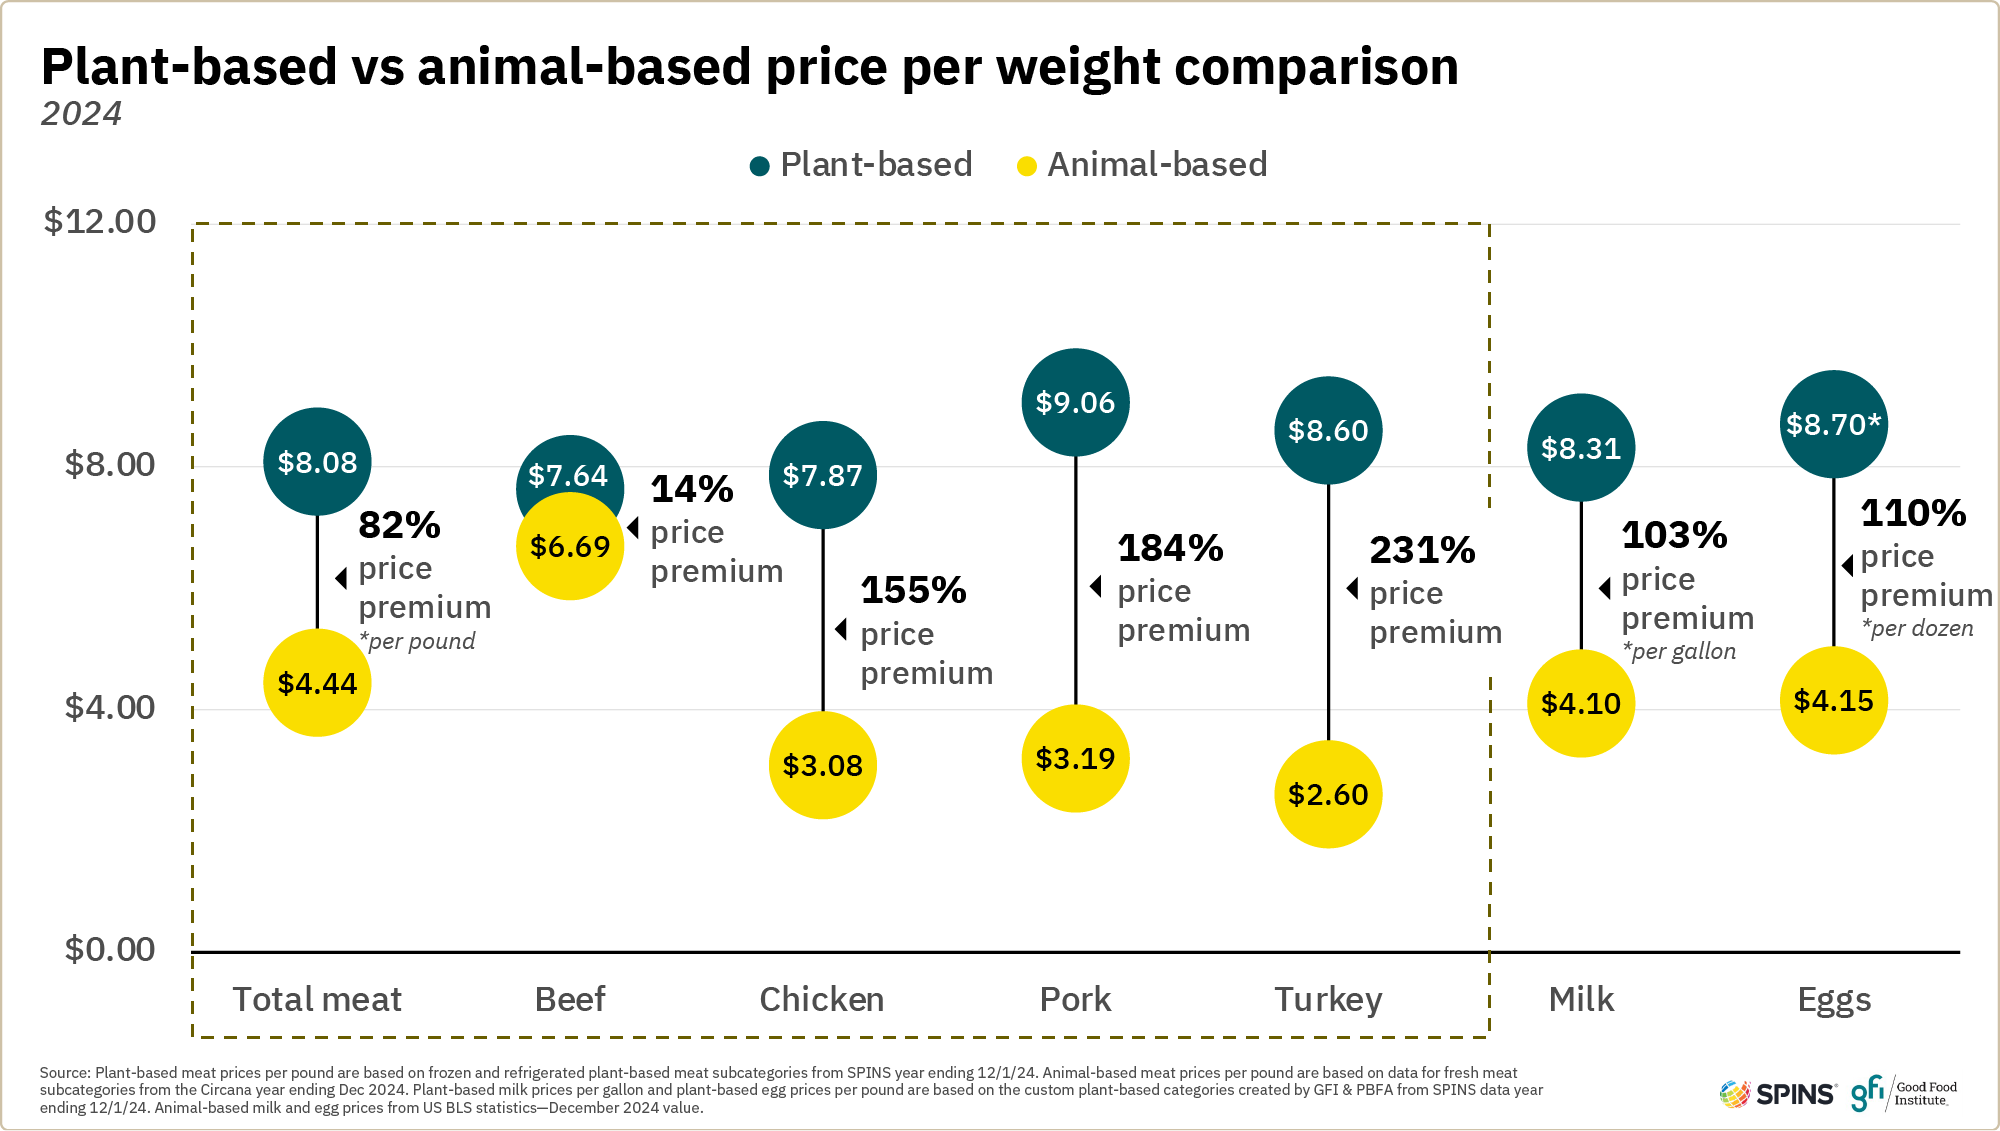
In 2024, prices were relatively stable across many plant-based categories. The total plant-based foods category showed a one percent increase in average retail price, led by plant-based meat and seafood average price increasing four percent. Most conventional categories experienced modest one to two percent price increases or decreases. This comes after back-to-back years of significant price growth across most plant-based and conventional categories.
Despite easing price growth, plant-based categories remained at significant price premiums to their conventional counterparts. In 2024, pound for pound, the average price premium was 82 percent for plant-based meat and seafood. Per dozen, the average price premium for plant-based eggs was 110 percent, and gallon for gallon, the premium for plant-based milk was 103 percent. Bringing down prices of plant-based foods will be critical for these products to effectively compete with conventional foods.
Purchase dynamics
Household penetration for the total sector declined slightly over the last two years, indicating that there are fewer shoppers engaged in the space.
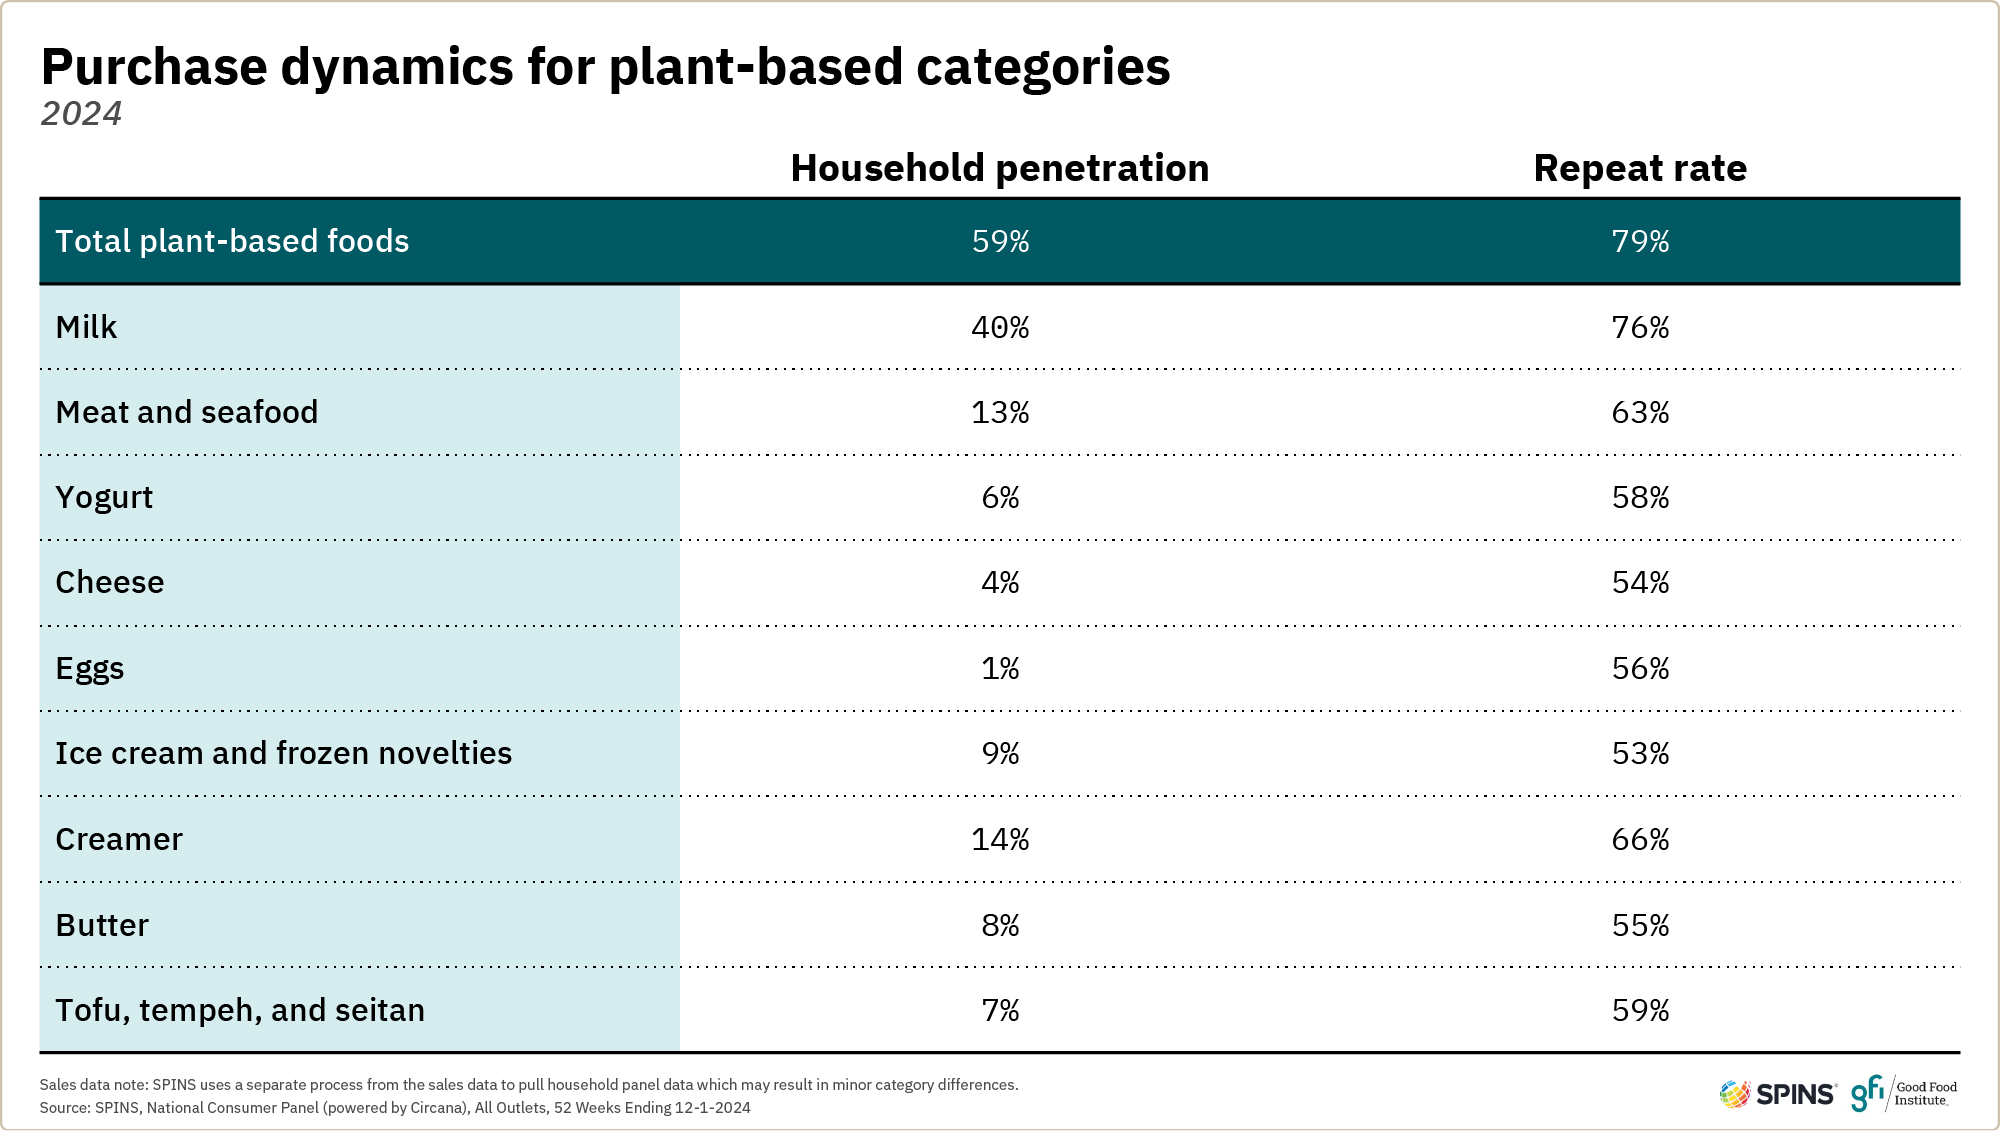
- The majority of households purchased plant-based products in 2024. 59% of U.S. households purchased plant-based foods in 2024. Nearly 80% of those households were repeat purchasers. Penetration is down slightly from 63% in 2022.
- Plant-based milk had the largest share of households purchasing among plant-based categories. Four in ten U.S. households purchased plant-based milk at least one time in 2024. Other categories with double-digit shares of households purchasing included plant-based creamer with a 14% penetration rate and plant-based meat and seafood with a 13% penetration rate.
- Shares of households purchasing changed relatively little across most plant-based categories in 2024. Notable exceptions were plant-based meat and seafood and plant-based yogurt, which each had roughly two point losses in share of households purchasing, indicating a need to reengage consumers. Most other categories had less than one point changes in household penetration.
- Repeat rates were steady or increased slightly across most plant-based categories in 2024. Plant-based cheese and eggs both experienced greater than five point increases in the share of purchasers who bought multiple times, a promising signal of products better meeting consumer demand. Plant-based milk continued to experience the highest repeat rate (76%) among plant-based categories.
- Households that purchased in one plant-based category were much more likely to be purchasers of other plant-based categories. For example, 21% of households purchasing plant-based milk also purchased plant-based meat and seafood, compared to 13% of total households. And 60% of households purchasing plant-based meat and seafood also purchased plant-based milk, compared to 40% of total households.
- Households that purchased both plant-based and conventional meat are high-value consumers. Households buying both plant-based and conventional meat spent 24% more by dollars (and 20% more by units) on total food purchases than the average household and 21% more by dollars (and 17% more by units) than households only buying conventional meat in 2024. Price points and household sizes likely play a role in this increased spending. Nonetheless, consumers purchasing plant-based meat and seafood are valuable shoppers.

Plant-based meat and seafood
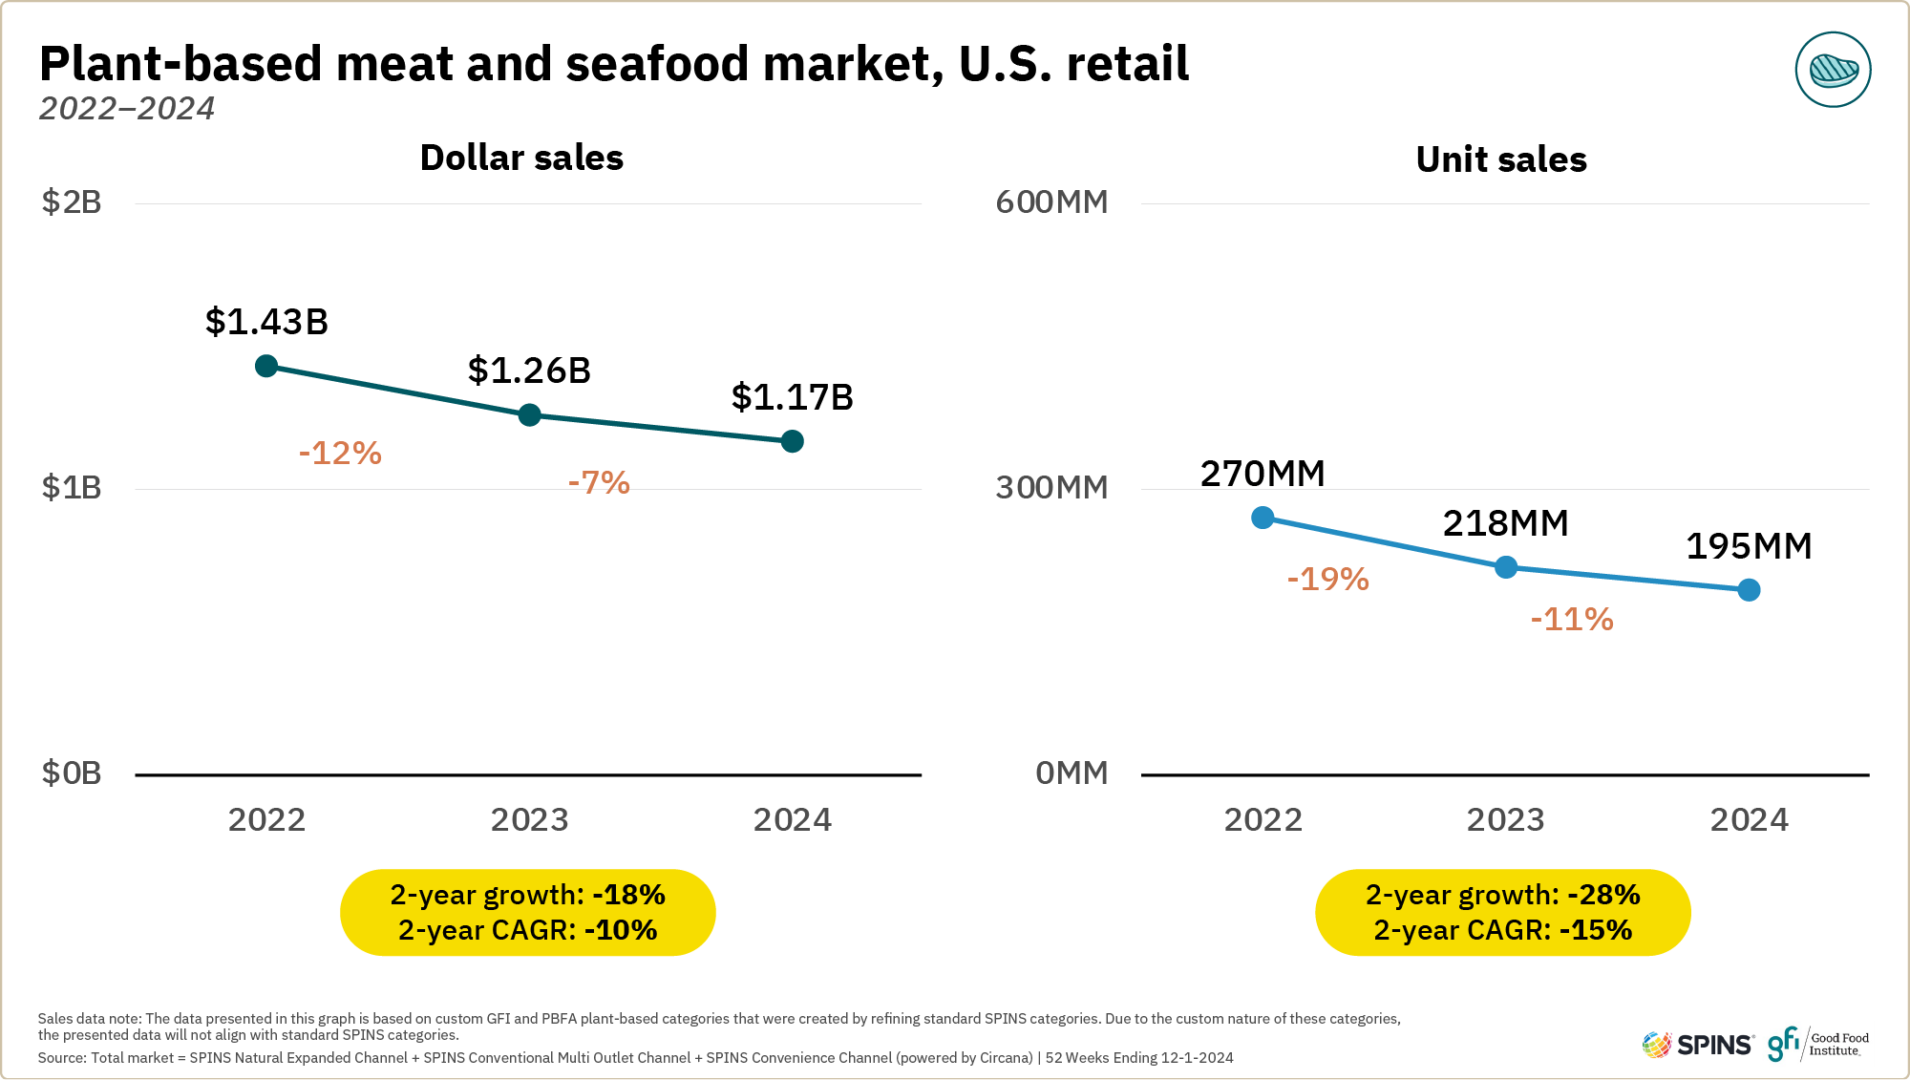
Although the market is significantly larger than it was a decade ago, plant-based meat and seafood saw sizable declines in recent years. Plant-based meat and seafood dollar sales were down seven percent and unit sales were down 11 percent in 2024.
Plant-based meat and seafood sales
2024 marked another year of sales declines for plant-based meat and seafood. However, rates of sales decline were slower than seen in 2023, and velocities showed improvement.
- Plant-based meat and seafood sales continued to fall in 2024. In the past two years, unit sales decreased 28% from 270 million units in 2022 to 195 million units in 2024.
- Plant-based meat and seafood’s market share declined slightly but remains relatively high in the natural channel. In 2024, plant-based meat and seafood’s share was 1.7% of total retail packaged meat dollar sales or 0.8% of the total meat category* (including random-weight meat), slightly down from 0.9% in 2023. In the natural channel, plant-based meat and seafood’s market share of packaged meat dollar sales was 8% (estimated to be over 4% of total meat including random weight).
- Attracting and retaining more households are opportunities for plant-based meat and seafood. In 2024, 13% of households purchased in the category, down from a high of 20% in 2021. In simplified terms, this decline alone could explain the amount of unit sales declines seen over the same timeframe. Notably, repeat purchase rates have stayed relatively flat. This signals that loyal shoppers maintained purchases while sales declines were driven by households leaving the category. Reengaging these households is a clear opportunity.
- There is room to capture a larger share of wallet among those buying both plant-based and conventional meat and seafood. Among households buying both plant-based and conventional meat and seafood in 2024, spend on plant-based meat was about $50 per buyer compared to $632 per buyer for conventional meat.
*SPINS does not report non-UPC animal-based meat counter sales, only UPC packaged meat sales. To calculate the plant-based meat and seafood share of the total meat category, GFI develops dollar and unit volume assumptions for non-UPC animal-based meat counter sales and adds them to the SPINS UPC animal-based meat sales.
Segment insights: Refrigerated vs. frozen vs. shelf-stable
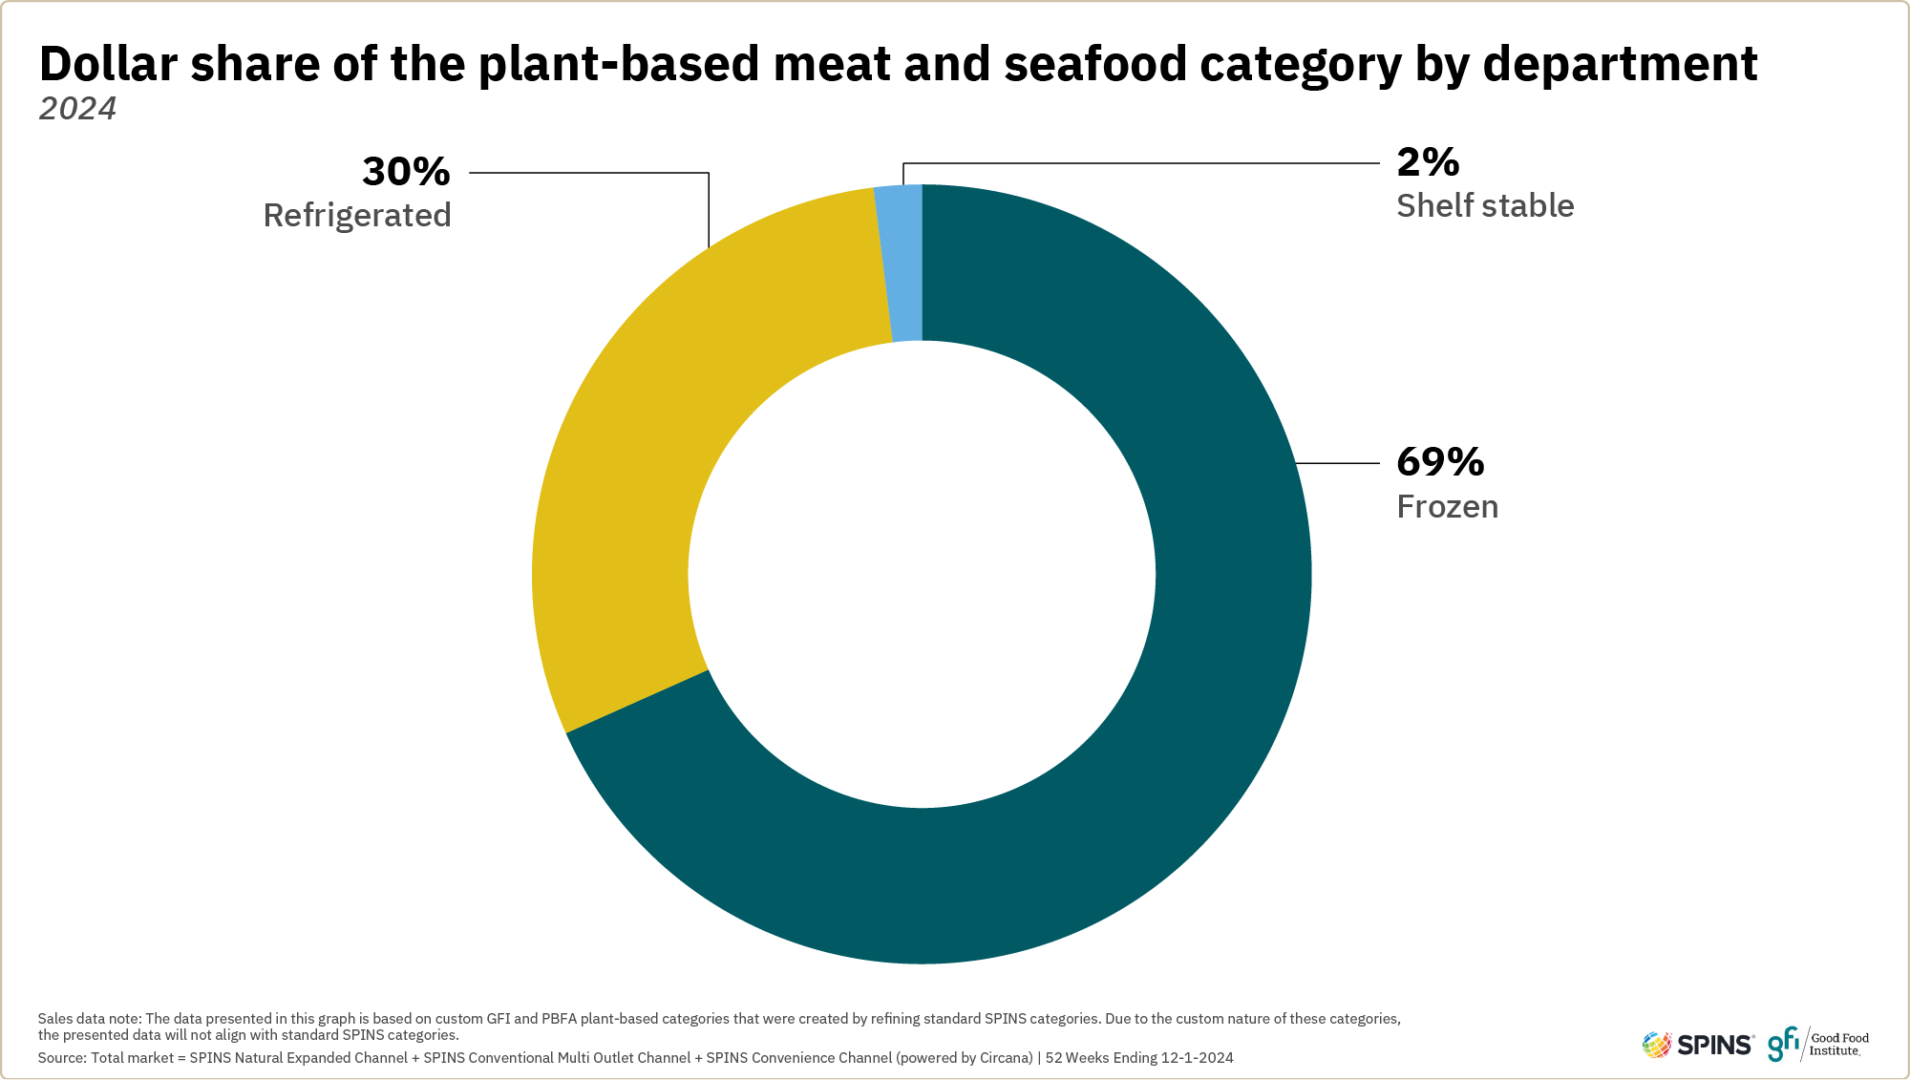
In 2024, the share of plant-based meat and seafood dollar sales in the frozen department grew to nearly 70 percent (up from 64 percent in 2022), followed by refrigerated at 30 percent (down from 32 percent in 2022) and shelf-stable at two percent.
- Refrigerated has seen significant unit sales declines. Refrigerated unit sales declined 33% from 2022 to 2024. Frozen unit sales declined at a slower pace, losing 23% from 2022 to 2024.
- Distribution was down across segments in 2024. Refrigerated distribution was down 12% in the conventional multi outlet (MULO) channel and 15% in the natural channel. However, the refrigerated segment experienced dollar velocity growth across channels, a change from 2023 when velocities were down significantly. Frozen distribution declined slightly less in 2024, losing 4% in the conventional multi outlet (MULO) channel and 12% in the natural channel.
- Several factors appear to be driving the shift from refrigerated to frozen.
- Retailers may be shifting products to the frozen department to extend shelf life, reduce effort associated with shelving products that are shipped frozen, and/or consolidate store sets.
- Notable product launches and line extensions in recent years have occurred in the frozen aisle, including steaks, nuggets, and cutlets, while new activity in the refrigerated aisle is relatively limited.
- It should be noted that the segment classification in the SPINS dataset may not always reflect where a given product is merchandised in the store (for example, a frozen product could be sold in the refrigerated department). Some of the apparent changes in the relative sizes of the refrigerated and frozen segments may be driven by these discrepancies.
- Historically, refrigerated plant-based meat and seafood was a key growth driver for the category. Refrigerated products were frequently shelved in the meat case (rather than a specialty vegan or plant-based case). This enabled it to be located in the section of the store where most shoppers look for center-of-plate proteins. Losing distribution in this section likely has an outsized impact on the category.
For more insights on how to capitalize on merchandising strategies for the plant-based meat and seafood market, check out our merchandising guide.
Segment insights: Plant-based meat and seafood formats
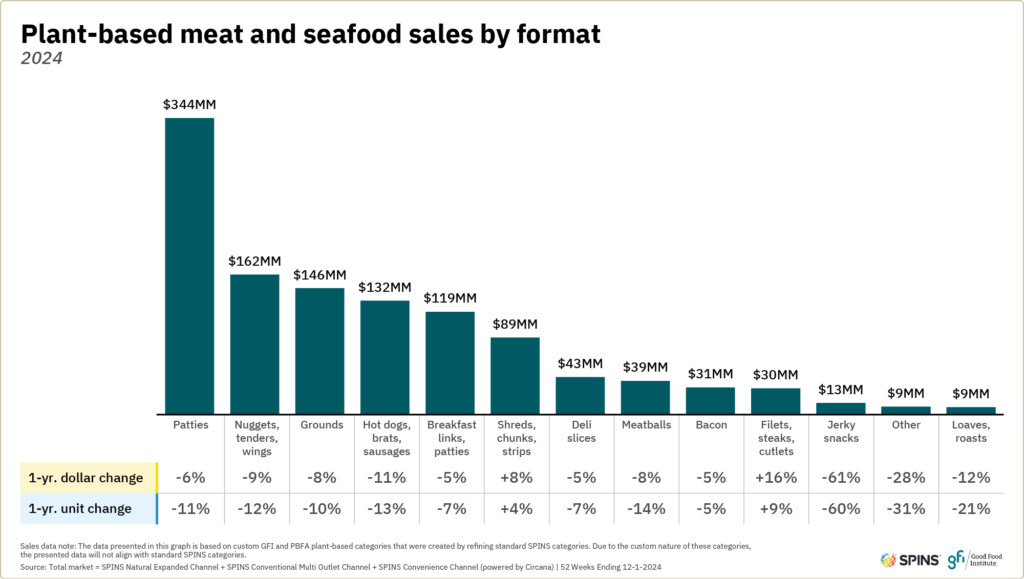
In 2024, plant-based patties continued to be the largest plant-based meat and seafood product type, followed by (2) nuggets, tenders, and wings, (3) grounds, (4) hot dogs, brats, and sausages, and (5) breakfast links and patties. Together, these five segments made up nearly 80 percent of all plant-based meat and seafood dollar sales. Meanwhile, recent product launches expanded other formats such as shreds, chunks, and strips and filets, steaks, and cutlets, which both saw double-digit dollar sales growth from 2022 to 2024.
Several plant-based meat and seafood formats have shares of their respective subcategories that are notably higher than the overall plant-based meat and seafood category average. We estimate that plant-based patties hold a six to seven percent share of total retail packaged meat patty dollar sales, compared to the 1.7 percent share plant-based meat and seafood holds of overall retail packaged meat dollar sales. Plant-based breakfast links and patties hold a roughly three to four percent dollar share and plant-based nuggets, tenders, and wings hold a roughly two to three percent share of their respective packaged meat subcategories.
Segment insights: Animal types
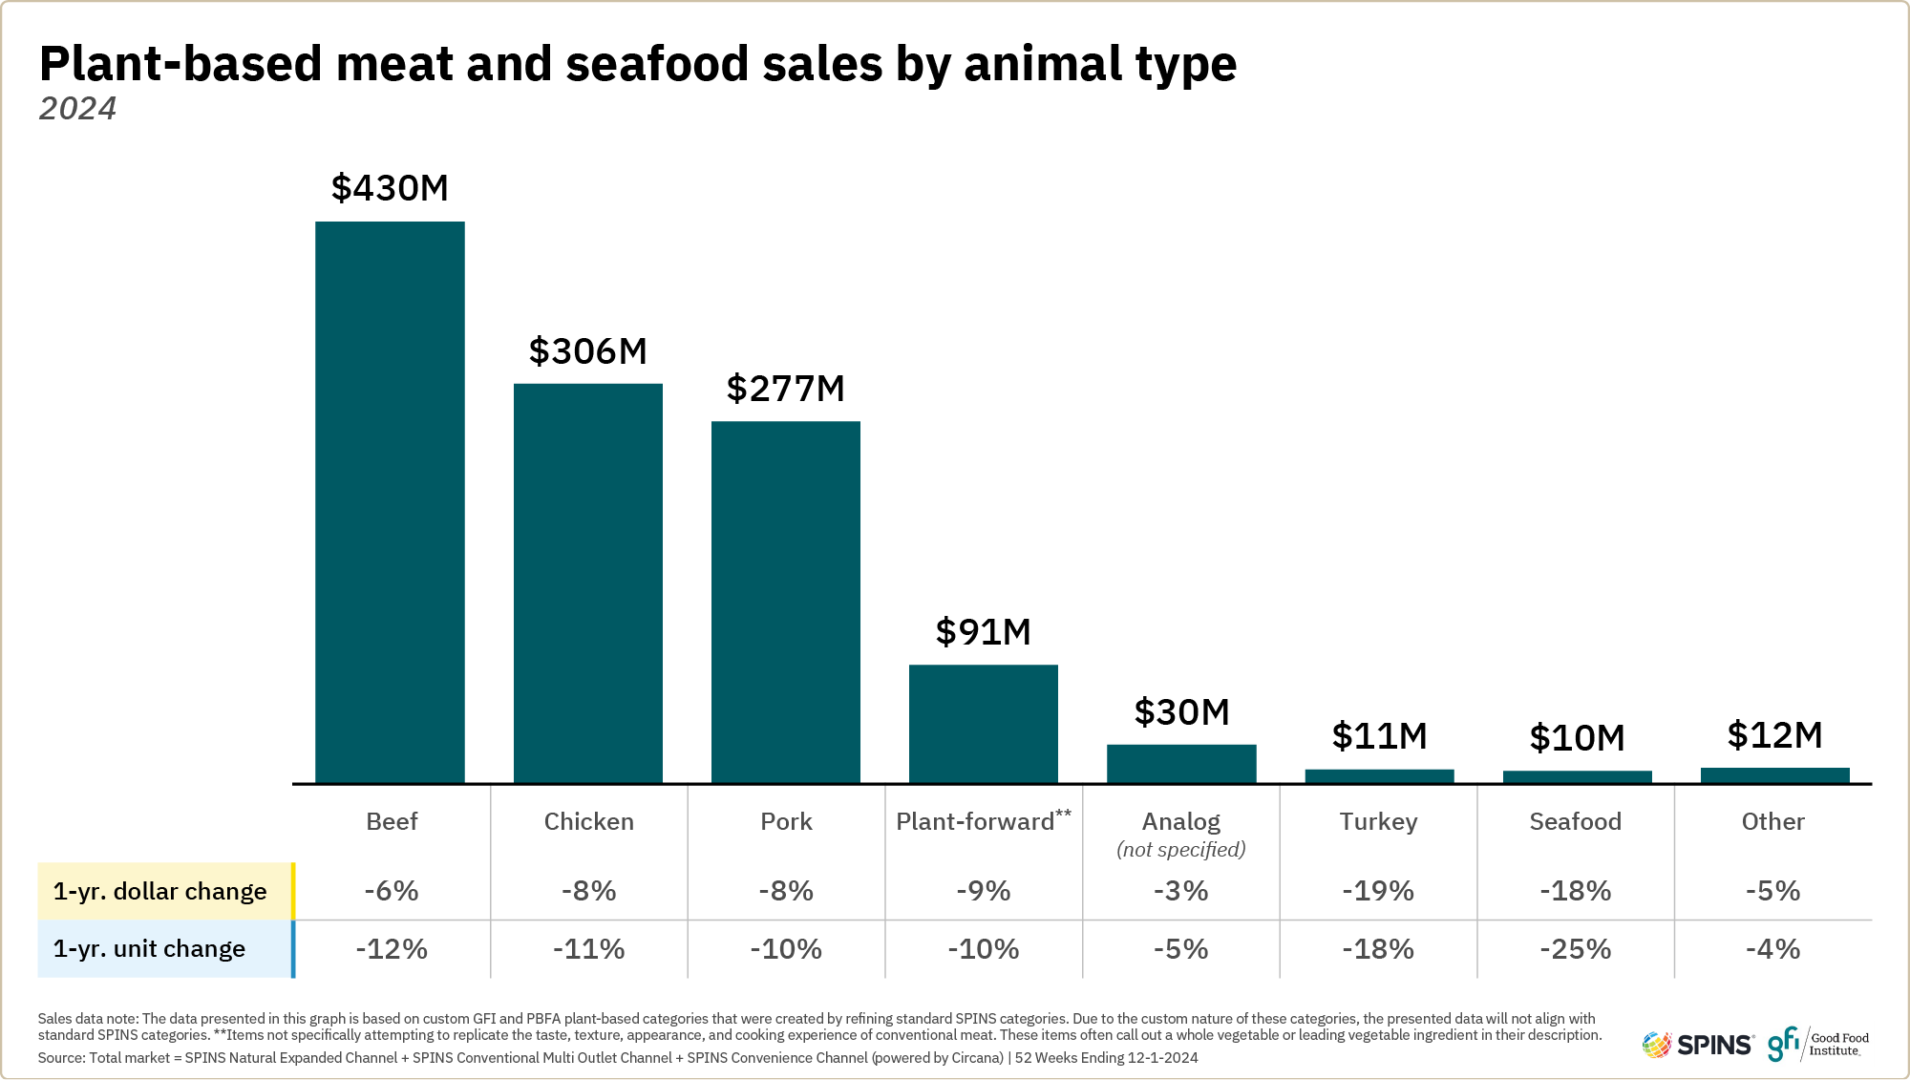
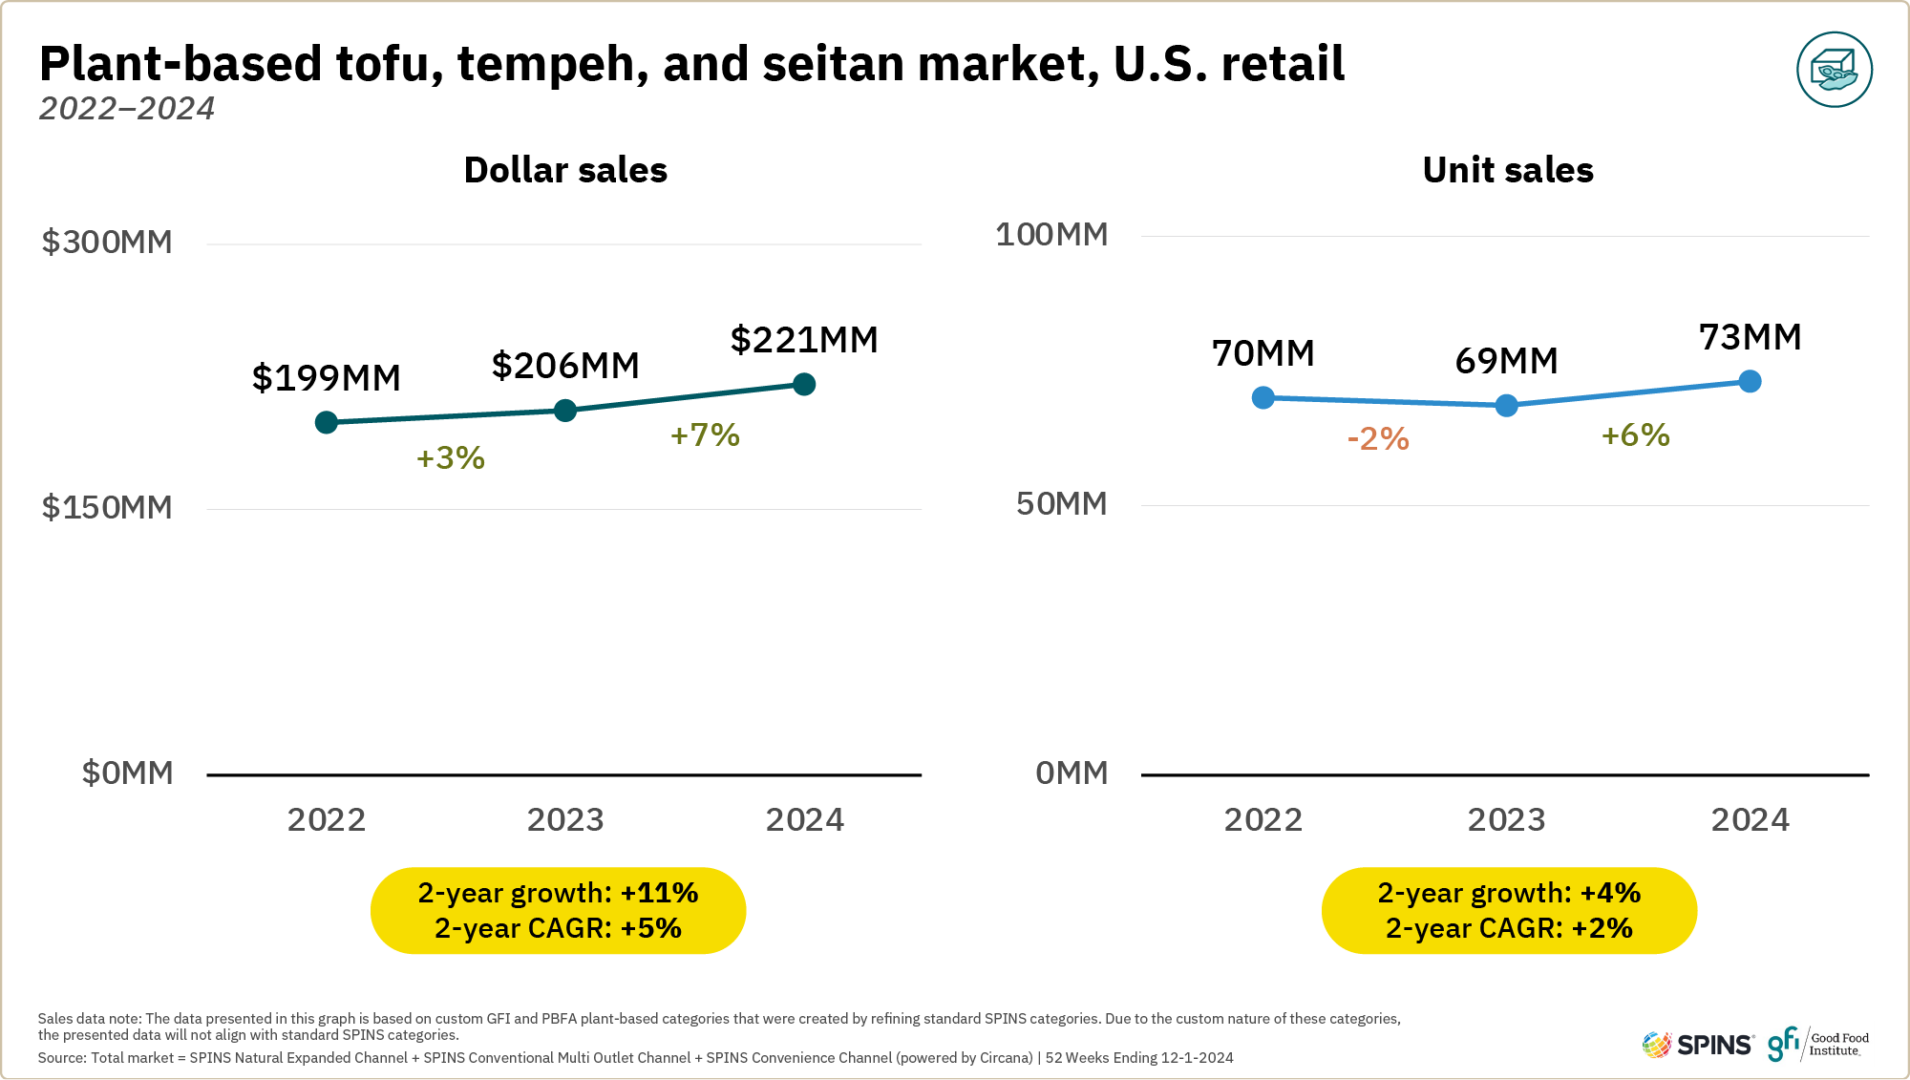
Plant-based beef remained the largest animal-type subcategory by dollar sales in 2024, followed by plant-based chicken and pork. Sales were down by similar amounts across the top animal types. While both analog products (like plant-based beef, chicken, and pork) and plant-forward products (like black bean burgers) experienced sales declines, plant-forward products declined more than analogs did. In the last 2 years, the plant-forward segment decreased 24 percent by dollars and 35 percent by units, while the analog segment decreased 18 percent by dollars and 28 percent by units. Analog products continue to account for the majority of sales in the plant-based meat and seafood category. Meanwhile, non-analog substitutes in the tofu, tempeh, and seitan category have been growing over the past 2 years, with dollar sales up 11 percent and unit sales up four percent, although the total category remains much smaller than plant-based meat and seafood.
The top-selling plant-based meat and seafood animal types account for shares of their respective subcategories that are notably higher than the overall plant-based meat and seafood category share. We estimate that plant-based chicken, beef, and pork products each hold a roughly two to three percent dollar share of their respective retail packaged meat categories, compared to the 1.7 percent share plant-based meat and seafood holds of overall retail packaged meat dollar sales.
Plant-based milk market
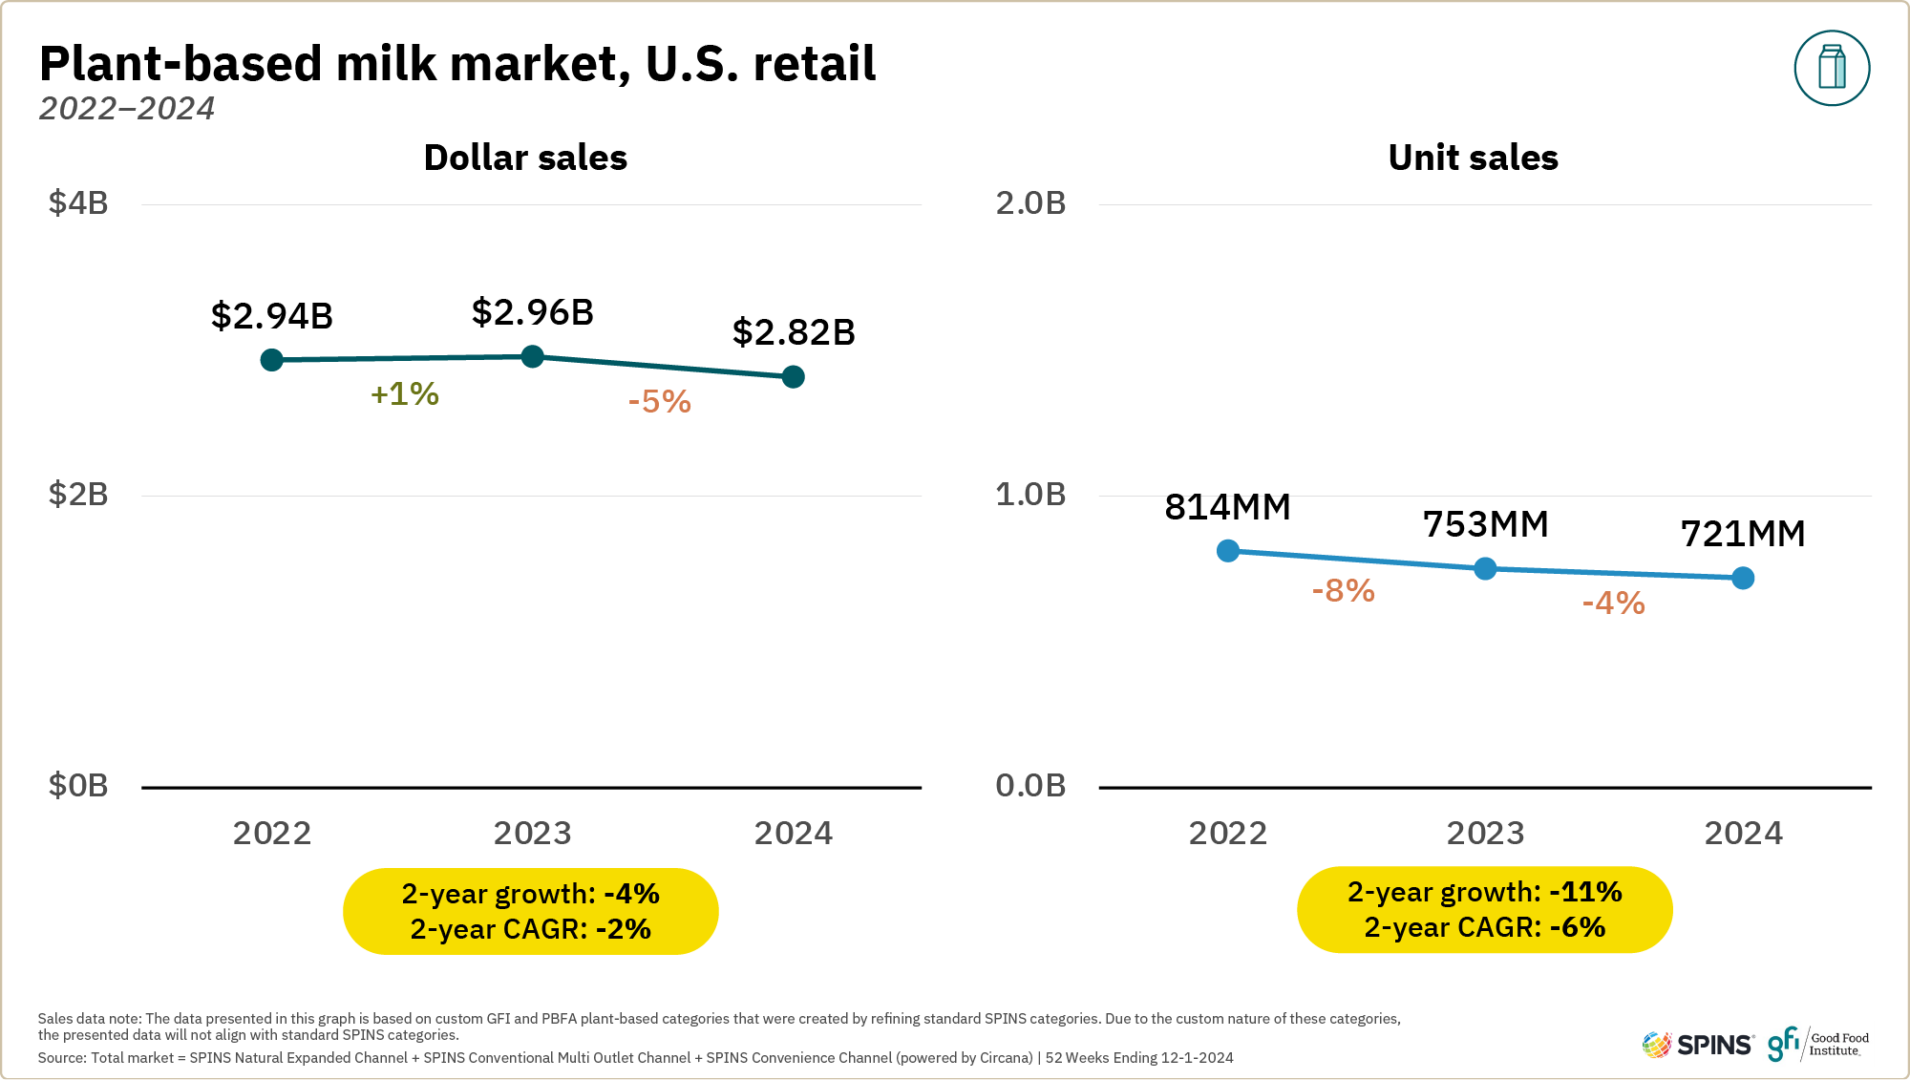
After growing dollar sales in 2023, the plant-based milk market declined five percent in 2024 to $2.8 billion. Despite declines, the category still accounted for 35 percent of all plant-based food dollar sales and played a key role in overall trends.
Plant-based milk sales
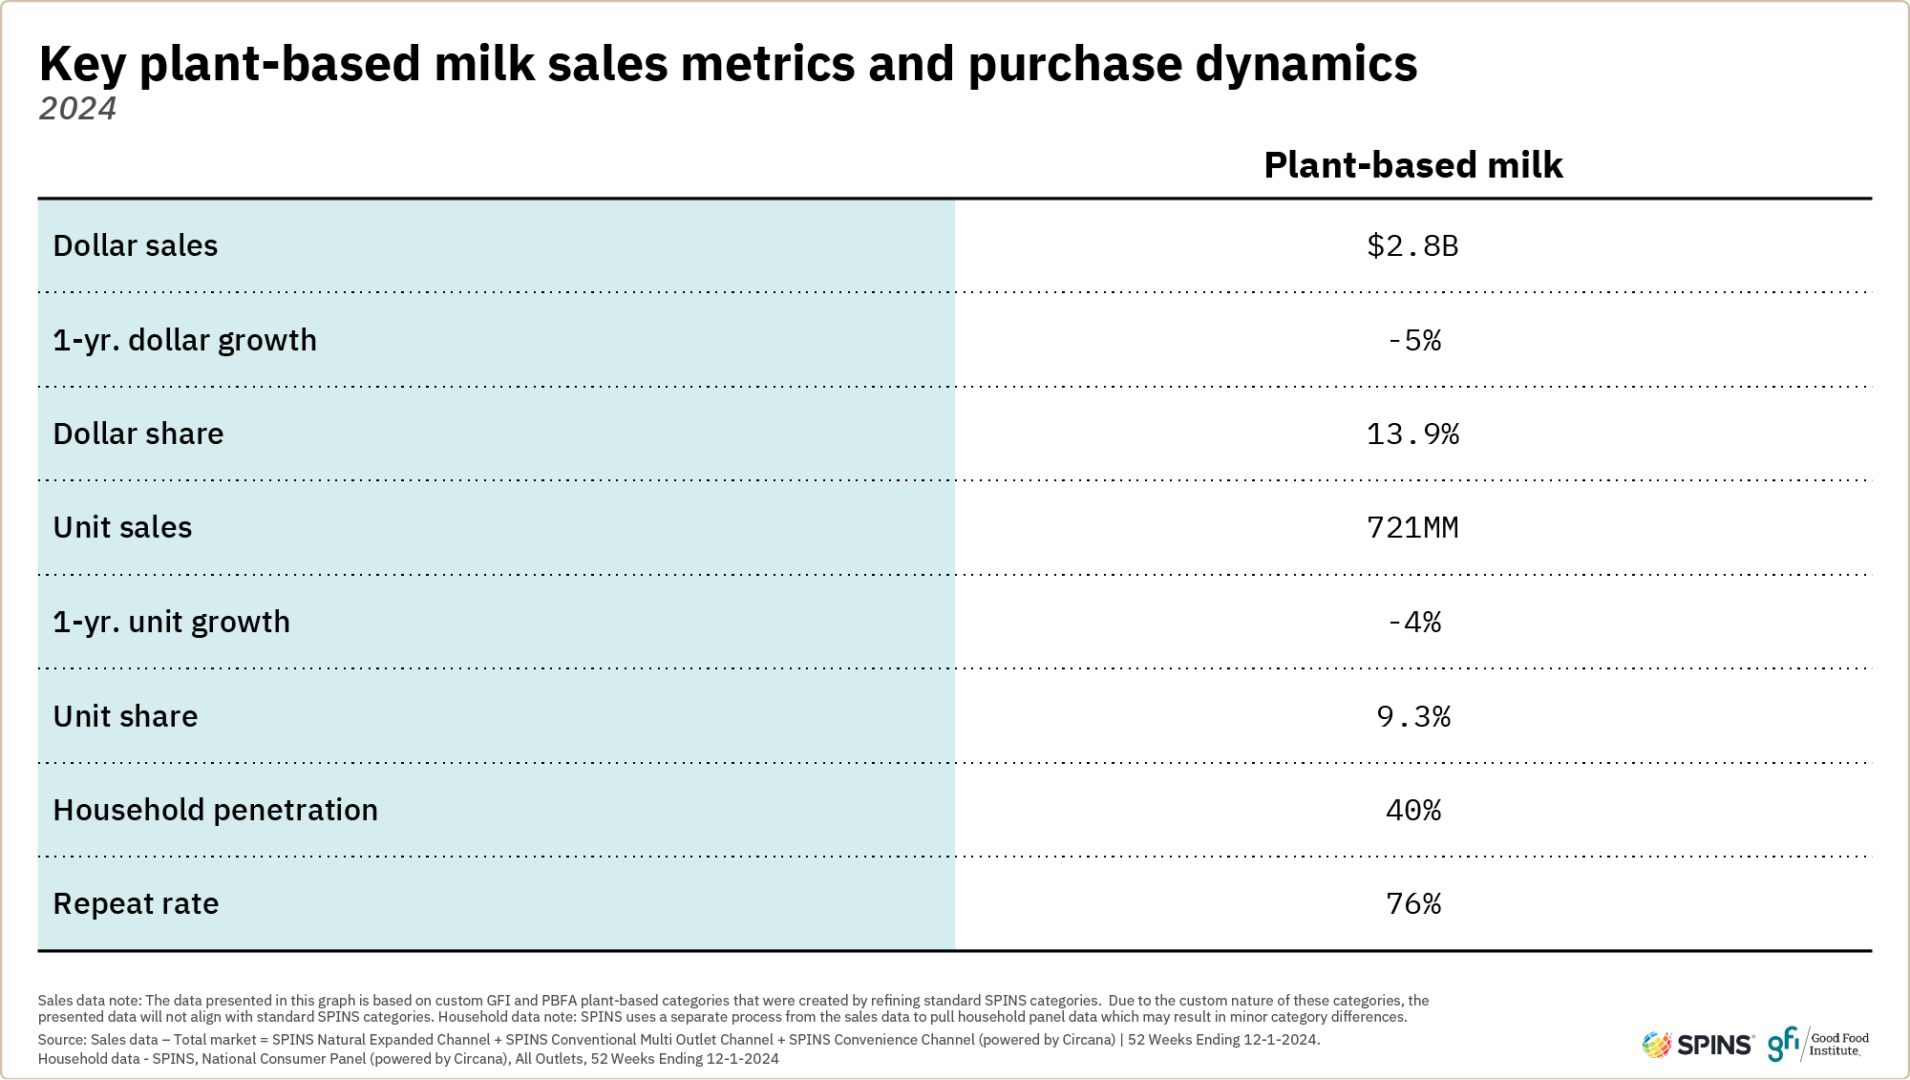
Plant-based milk remains a sizable category at $2.8 billion, but dollar sales were down five percent and unit sales down four percent in 2024. Slightly larger dollar declines were driven by average retail prices coming down one percent. Conventional milk dollar sales increased by one percent, while unit sales increased by three percent.
- Four in ten U.S. households purchased plant-based milk in 2024. Penetration rate was relatively unchanged from 2023. Repeat rates held steady, with 76% of households purchasing in the plant-based milk category more than once.
- Plant-based milk is a significant part of the overall milk category. Plant-based milk made up about 14% of total milk category dollar sales in 2024 and about 13% of unit sales. Innovation often starts in the natural channel, where plant-based milk represented 36% of all milk sold by dollar sales.
- Some top brands experienced growth in 2024. Among the ten top-selling plant-based milk brands in 2024, five brands had sales growth. These five brands collectively experienced 10% growth in dollar sales from 2023 to 2024.
- Households with young children were more likely to spend more on the plant-based milk category. This demographic trend was consistent in recent years.
Segment insights: Plant-based milk ingredient base
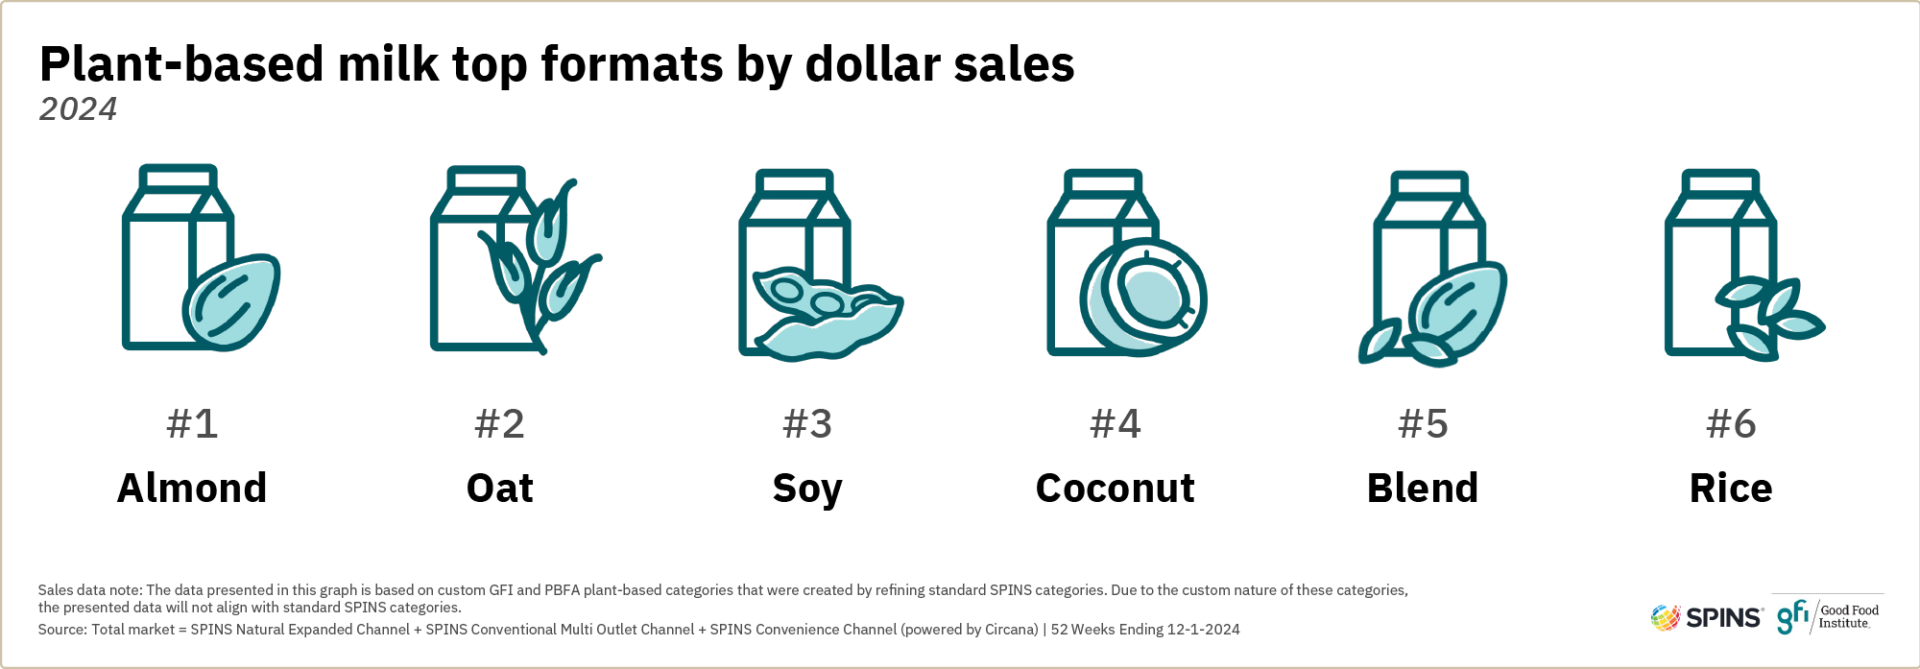
In 2024, almond, oat, and soy remained the top ingredient bases for plant-based milk.
- Almond milk is the largest segment of the plant-based milk category. Almond milk accounted for 54% of 2024 sales. Its dollar share of the category fell from 58% in 2022 as other formats gained ground.
- Oat milk captured much of the share lost by almond milk. Oak milk jumped from 22% dollar share of the category in 2022 to 25% in 2024. Oat milk saw modest unit sales growth of 1% in 2024, likely bolstered by a 2% reduction in average retail price. Dollar sales were down 1%.
- Coconut milk continued to experience significant growth in 2024. Coconut milk was up 14% in unit sales and 16% in dollar sales. Still, it trailed almond, oat, and soy in total dollar sales and represented only 5% of category dollar sales.
- Soy milk maintained its share of the plant-based milk category. Soy milk has held a 7% share of category dollar sales for the past three years. In 2024, soy milk dollar sales were up slightly by 2% while unit sales were unchanged.
Segment insights: Refrigerated vs. shelf-stable plant-based milk
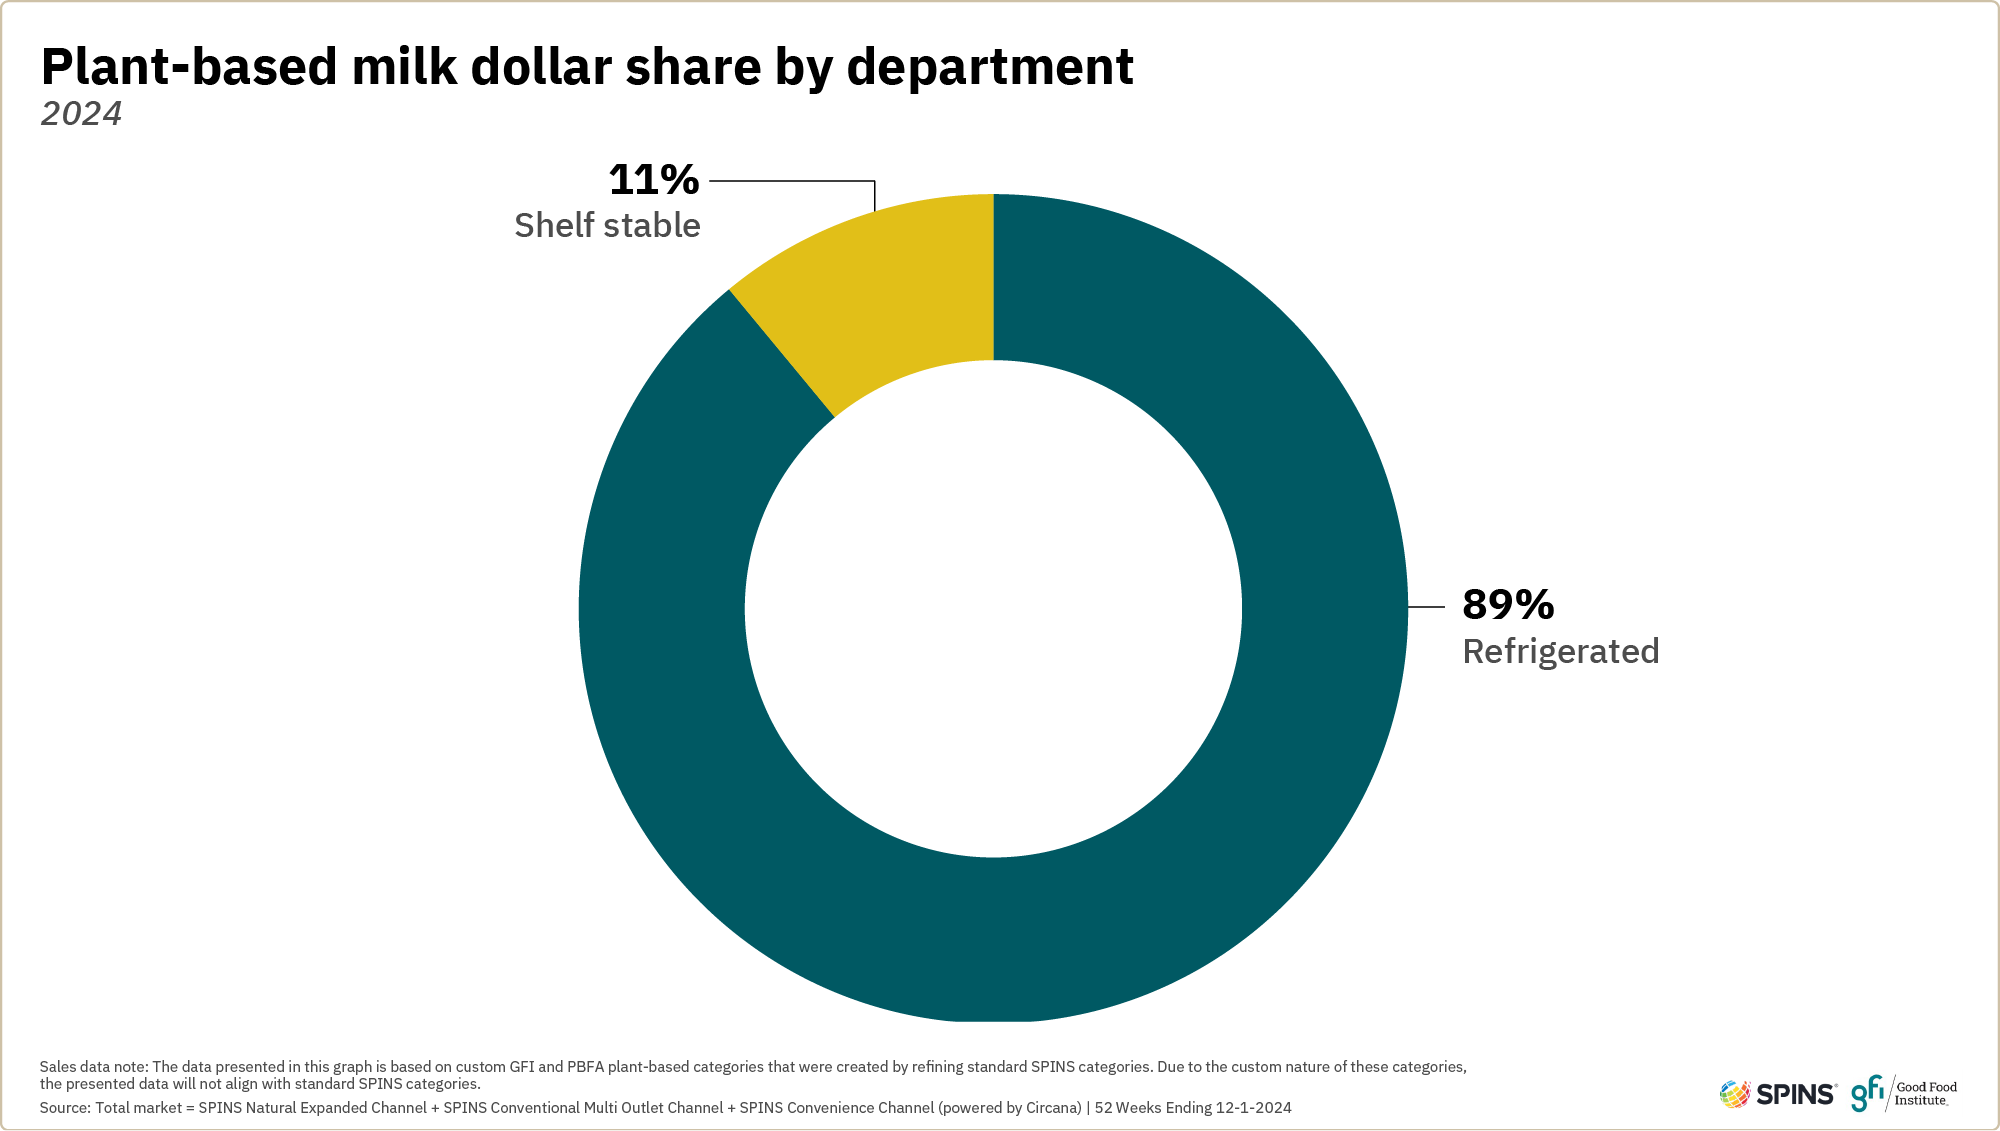
Refrigerated plant-based milk continued to dominate the category, representing 89 percent of plant-based milk dollar sales, unchanged from 2023. Today, refrigerated plant-based milk is consistently shelved adjacent to animal-based milk and benefits from this merchandising strategy. It ensures that omnivore consumers can understand their choices and make a decision in the refrigerated section, where they are already shopping for milk products. This has been critical to the growth of plant-based milk to the 14 percent market share of total milk dollar sales it has today.

The market for other plant-based dairy and eggs
Other plant-based dairy and egg categories are in various stages of maturation.
Creamer
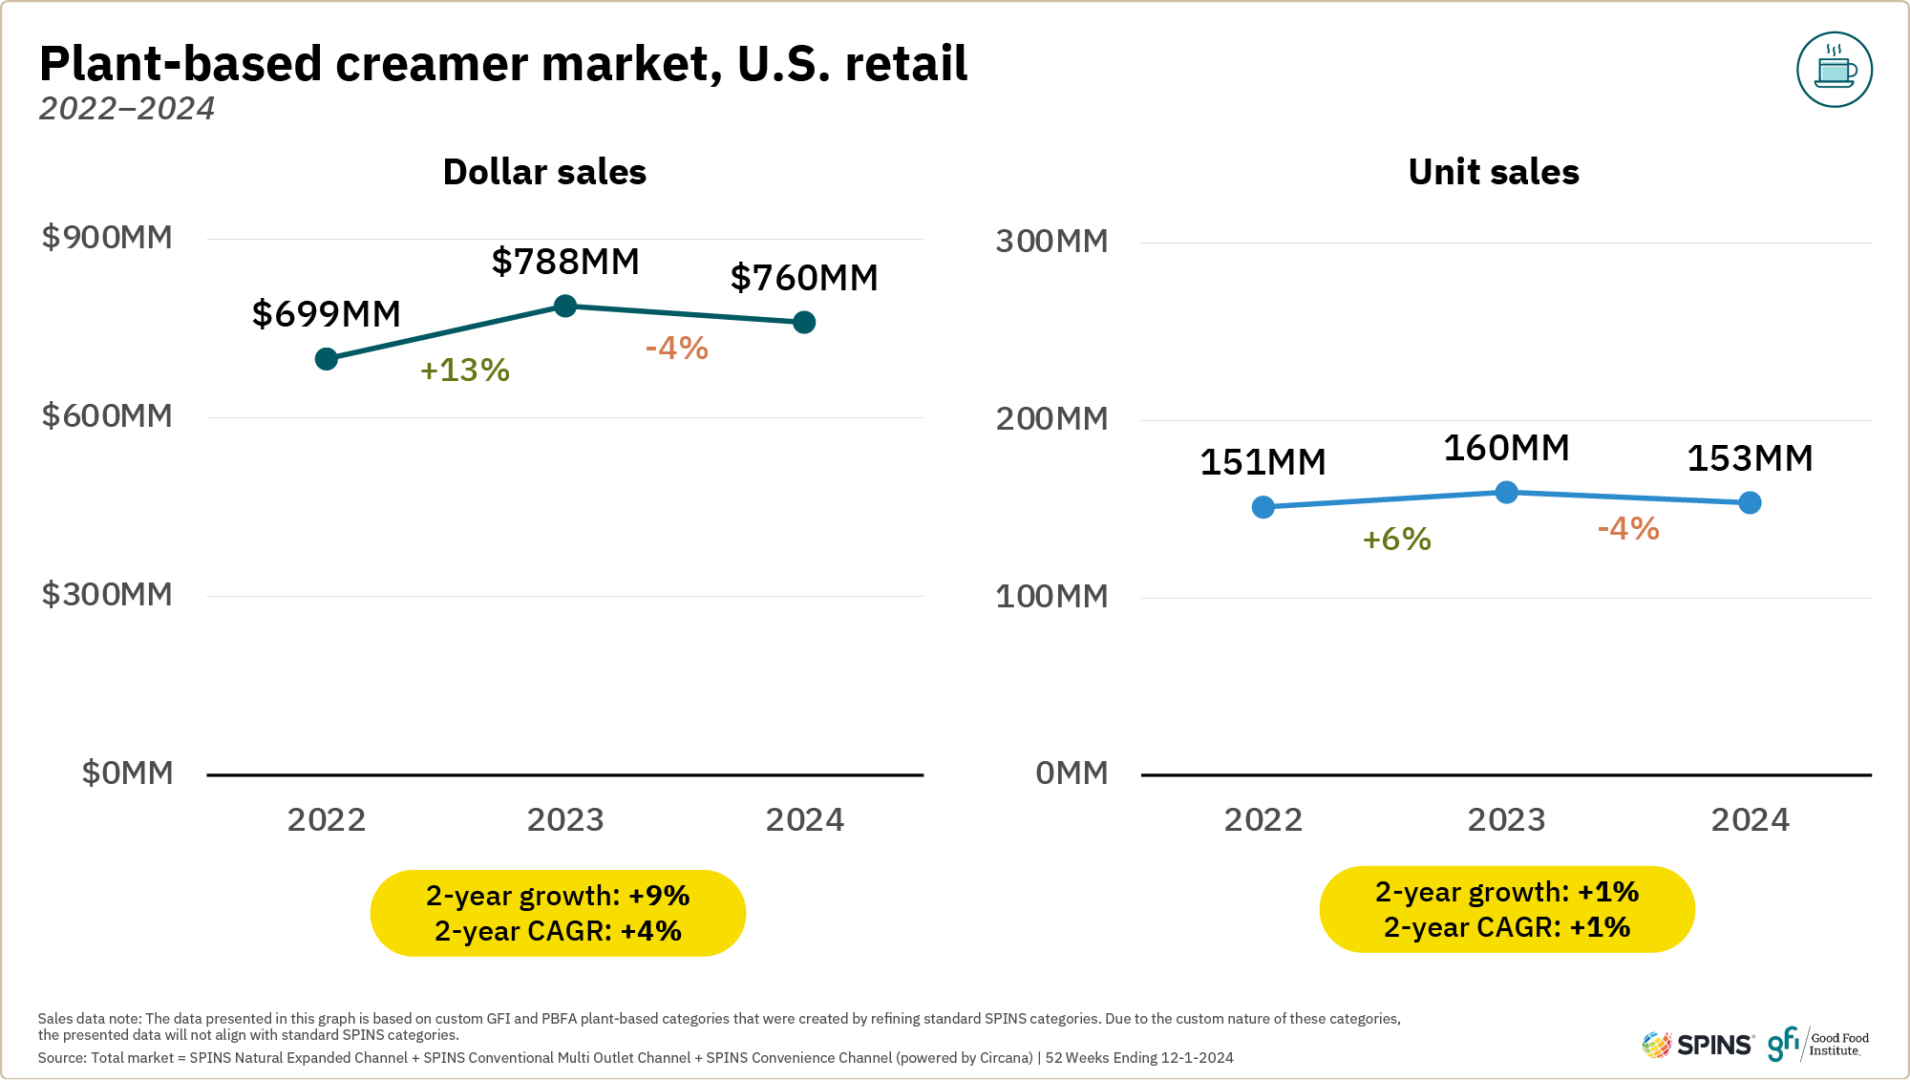
The plant-based creamer category declined slightly in 2024 with both dollar and unit sales down four percent, after several years of growth.
- The plant-based creamer category is much larger than several years ago. Consumer familiarity with plant-based milk, the largest plant-based category, and growing affinity for plant-based creamers in their beverages allowed this category to excel even in a difficult environment. From 2022 to 2024, the category grew 9% in dollar sales and 1% in unit sales, on top of growing roughly 22% in dollar sales and 10% in unit sales from 2021 to 2022.
- Plant-based creamer’s market share of total creamer was 8% in 2024. This was the second-highest share rate among plant-based categories, behind plant-based milk. Dollar sales of plant-based creamer products accounted for 27% of all creamer sales in the natural channel.
- Conventional creamer gained ground in 2024. While plant-based creamer sales were down slightly in 2024, conventional creamer grew 6% in dollar sales and 3% in unit sales. As a result, plant-based creamer lost about half a percentage point in share of the total creamer market.
- 14% of households purchased plant-based creamers in 2024. Additionally, 66% of these households were repeat purchasers, the second highest rate of repeat purchase for plant-based categories, behind only plant-based milk.
- Households purchasing plant-based creamer tend to purchase other plant-based categories as well. For example, 67% of households purchasing plant-based creamer also purchased plant-based milk in 2024, compared to just 40% of total households purchasing plant-based milk.
Ice cream and frozen novelty
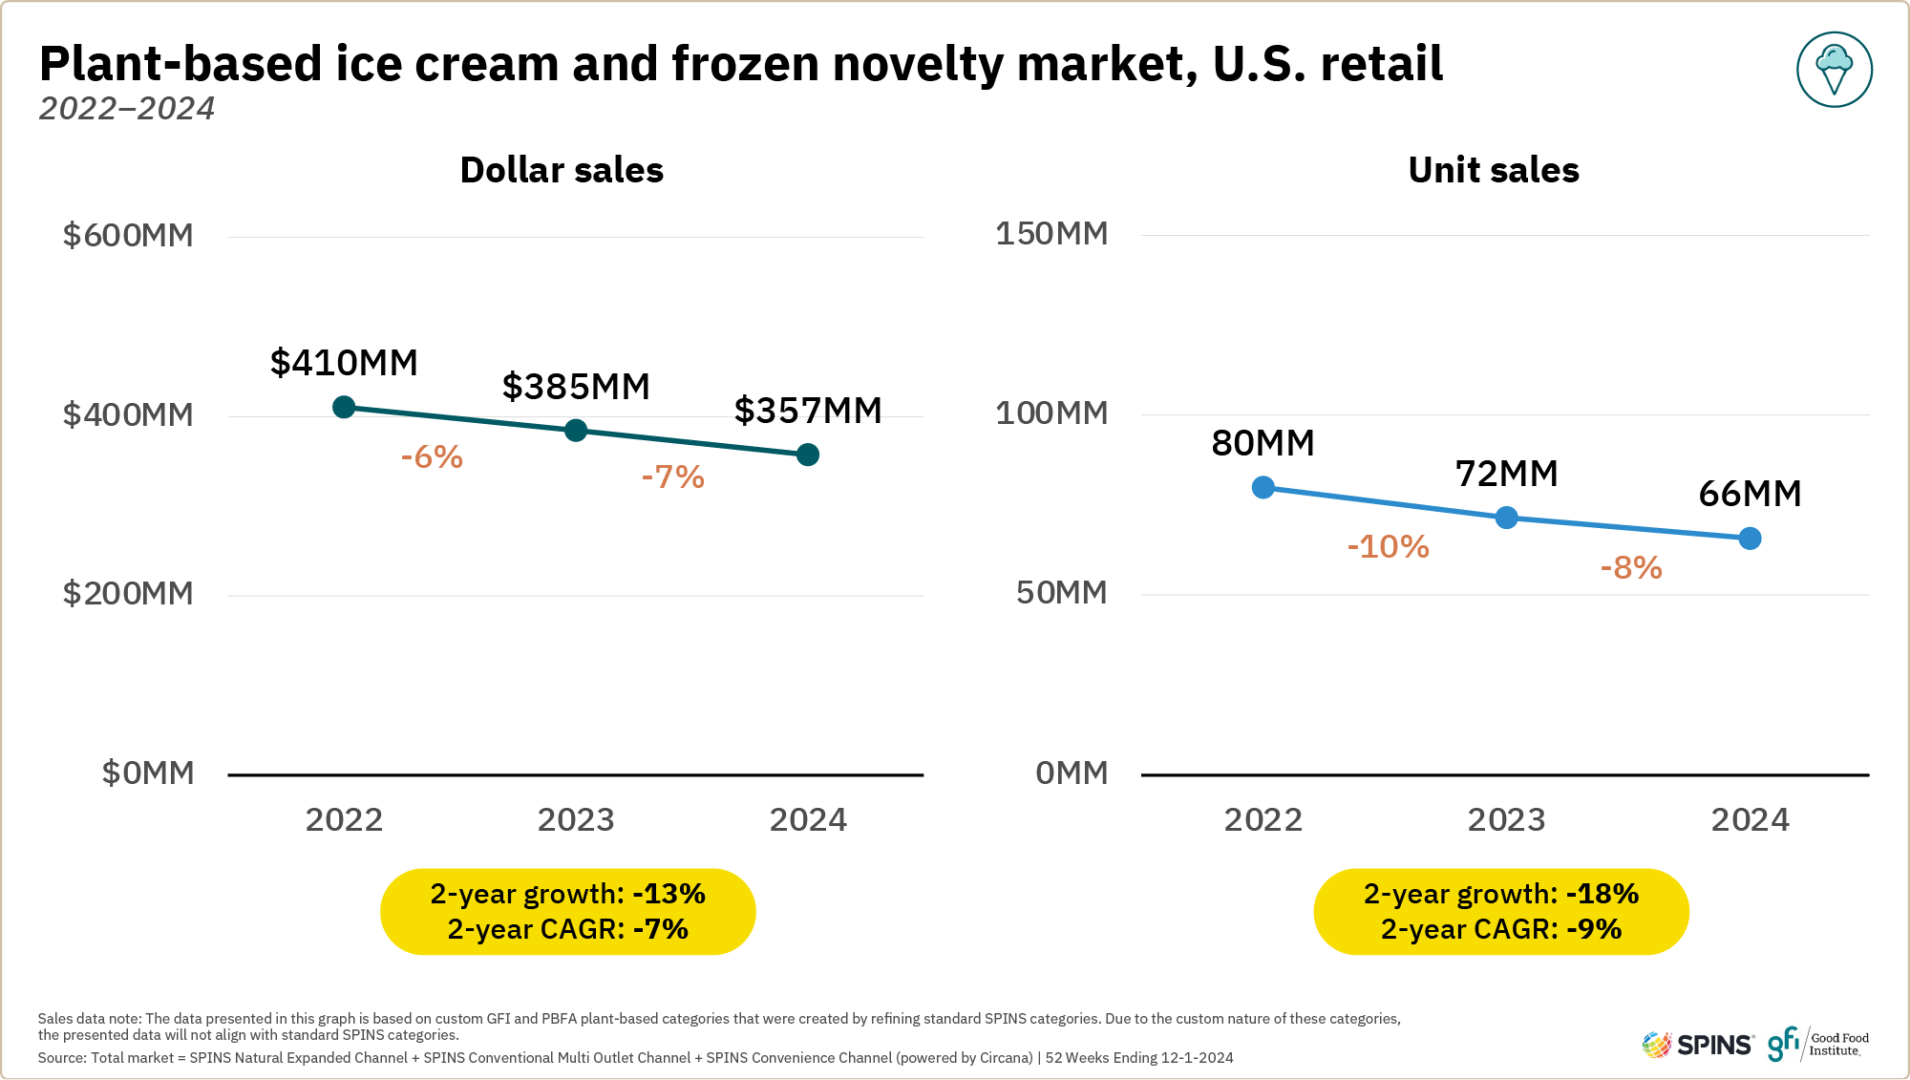
The plant-based ice cream and frozen novelty category experienced declining dollar and unit sales in 2024, continuing trends from 2023.
- Unit sales declines were comparable to dollar sales losses, as prices held fairly steady. Prices also showed little change in conventional ice cream after back-to-back years of growth driven by inflation.
- Companies tested new bases. Similar to the plant-based milk category, plant-based ice cream and frozen novelty saw diversification of ingredient bases—like oat—in recent years.
- Plant-based ice cream and frozen novelties were purchased by about one in ten U.S. households in 2024. This category holds the fourth highest rate of household penetration among tracked plant-based categories, behind milk, creamer, and meat and seafood.
- Younger consumers were more likely to be plant-based ice cream buyers. Millennials were more likely to buy and spend more on plant-based ice cream than other generations in 2024. Gen Z consumers were also slightly more likely to buy in the category.
Yogurt
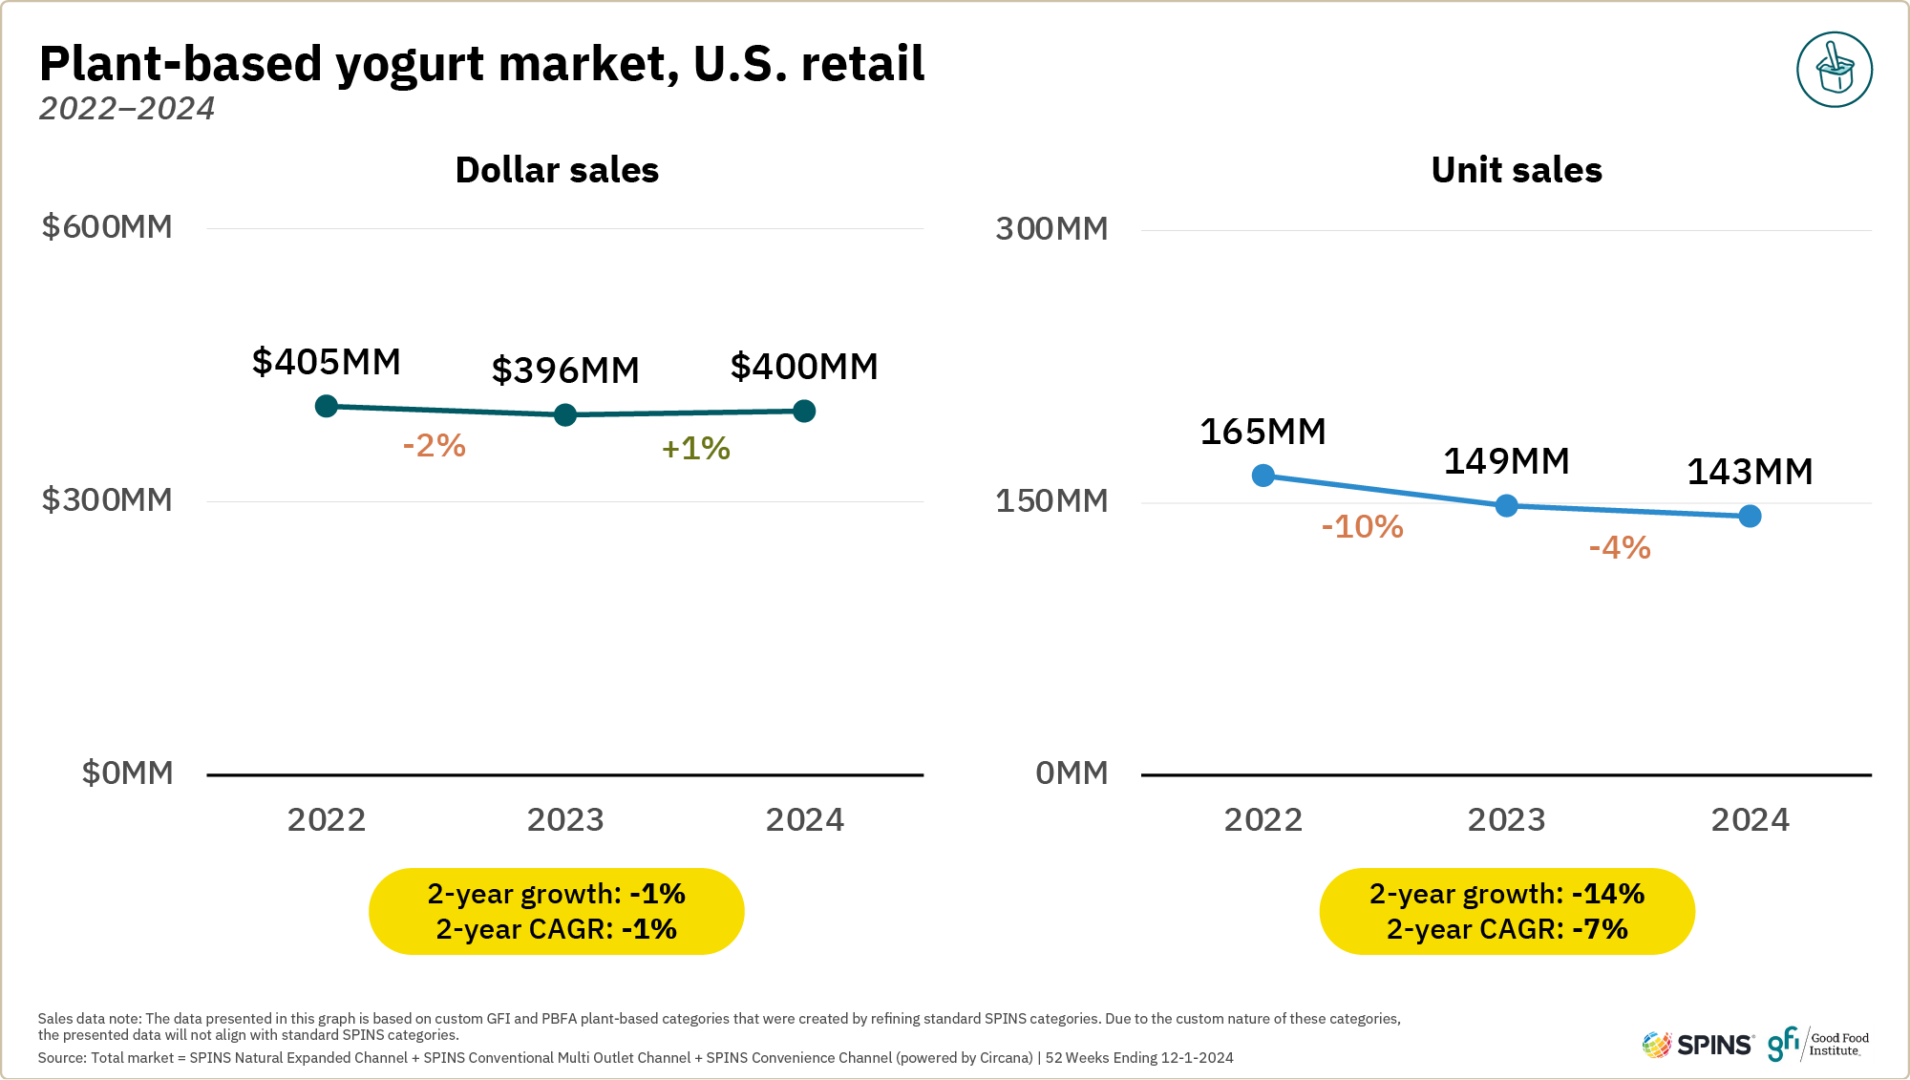
Plant-based yogurt rebounded after declining in both dollar and unit sales in 2023. In 2024, plant-based yogurt dollar sales were up one percent, bolstered by increasing average prices, while unit sales were down four percent.
- Plant-based yogurt’s market share of total yogurt declined slightly but remained substantial. In 2024, plant-based yogurt accounted for 3.5% of total yogurt sales in the overall retail space and over 17% in the natural channel. Share grew slightly in the natural channel in 2024.
- Conventional yogurt grew in 2024. Conventional yogurt dollar sales were up 8% while unit sales were up 5%.
- 6% of households purchased plant-based yogurt. While penetration was down slightly from 2023, repeat rates were up from 54% in 2023 to 58% in 2024, suggesting products are better meeting consumer needs.
- Younger families were more likely to purchase plant-based yogurt. Millennial consumers and households with young children were more likely to buy and spend more on plant-based yogurt in 2024.
- A significant amount of households purchasing plant-based yogurt also purchased other key plant-based categories. 34% of these households also bought plant-based meat and seafood in 2024, versus just 13% of total households. 75% bought plant-based milk, compared to 40% of total households.
Butter
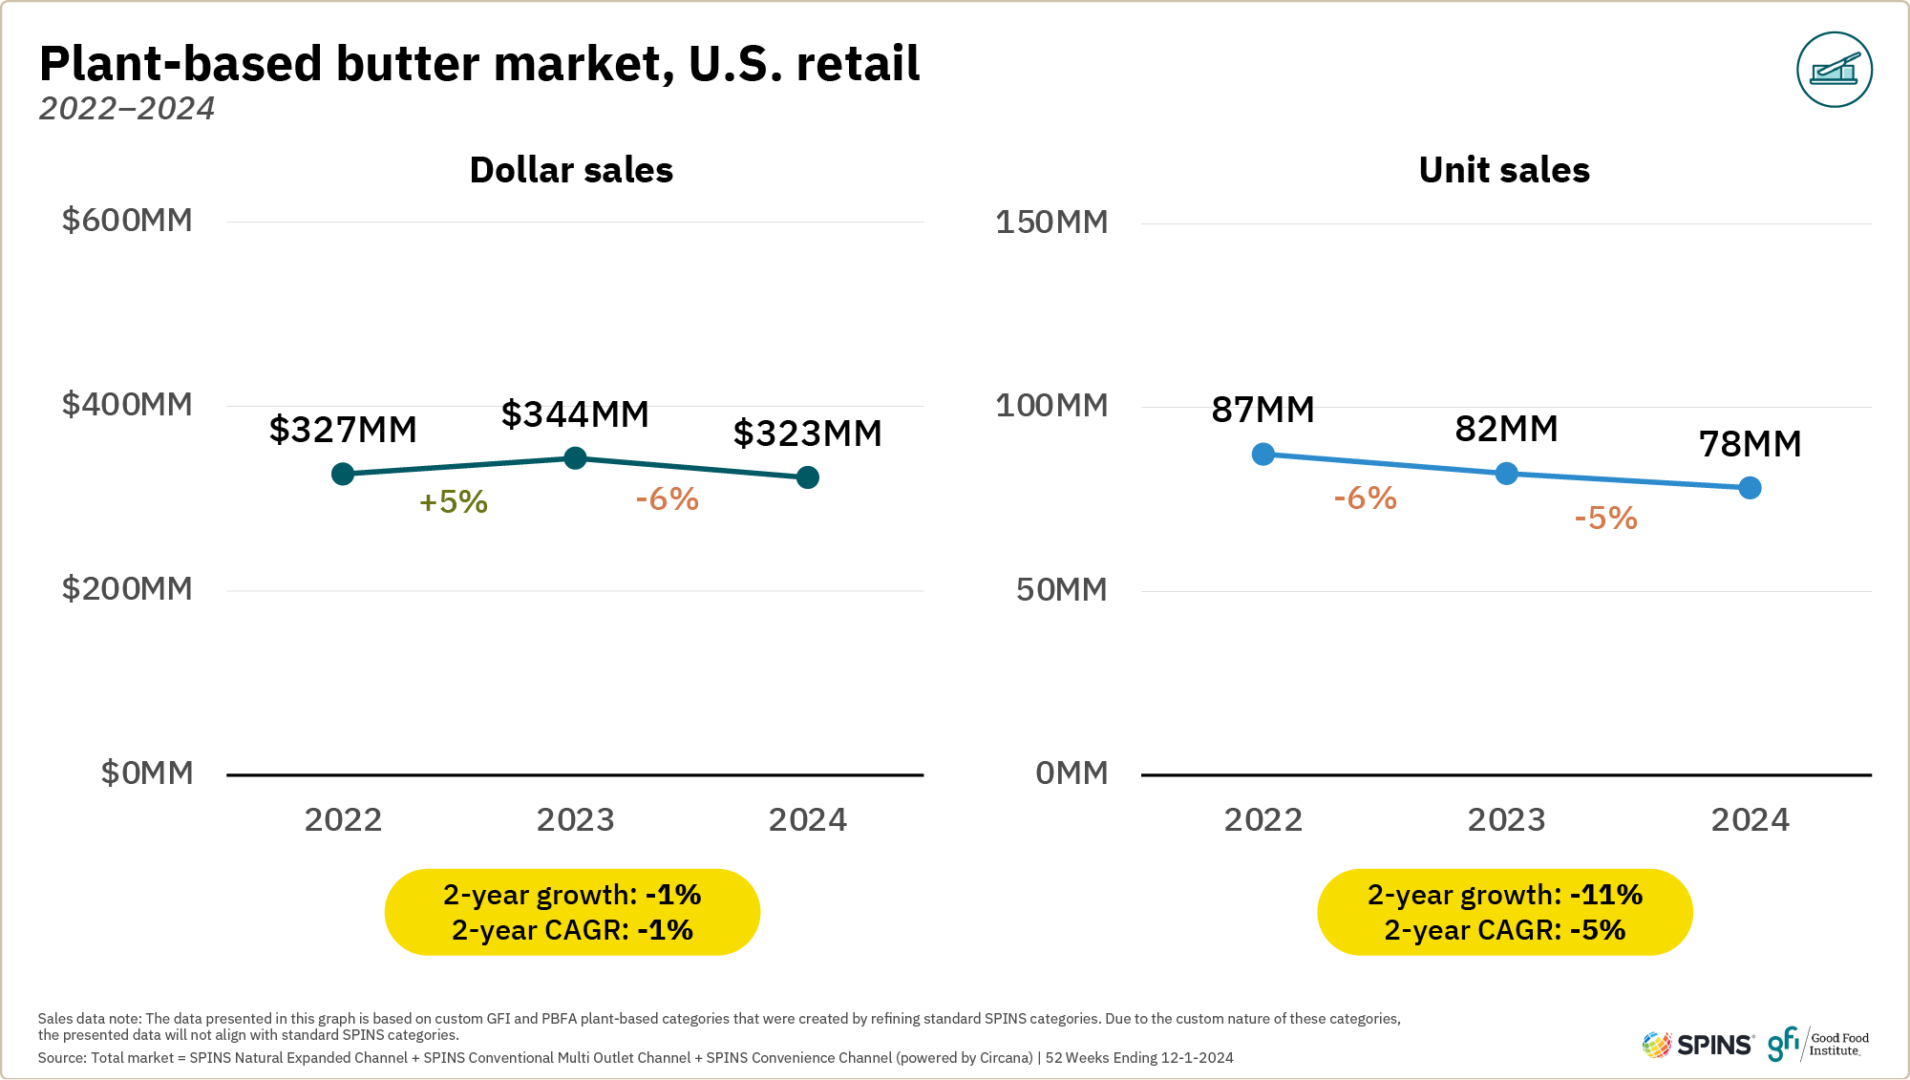
Plant-based butter experienced dollar and unit sales declines in 2024.
- Dollar and unit sales of plant-based butter were down similar amounts. Dollar sales were down 6% while unit sales were down 5%. Prices were down just slightly by 1%, following back-to-back years of significant increases.
- Plant-based butter’s market share of total butter decreased slightly. In 2024, plant-based butter composed 4.7% of dollar sales for the total butter market, down about half a percentage point from 2023.
- 8% of households purchased plant-based butter. Repeat rates were up slightly from 52% in 2023 to 55% in 2024.
- As defined in this data set, the plant-based butter category is dominated by vegetable oil-based margarines and spreads. However, the last few years saw the launch and growth of several products more directly positioning themselves as plant-based butter products. This innovation may be helping bolster repeat rates as new products better meet consumer needs.
Cheese
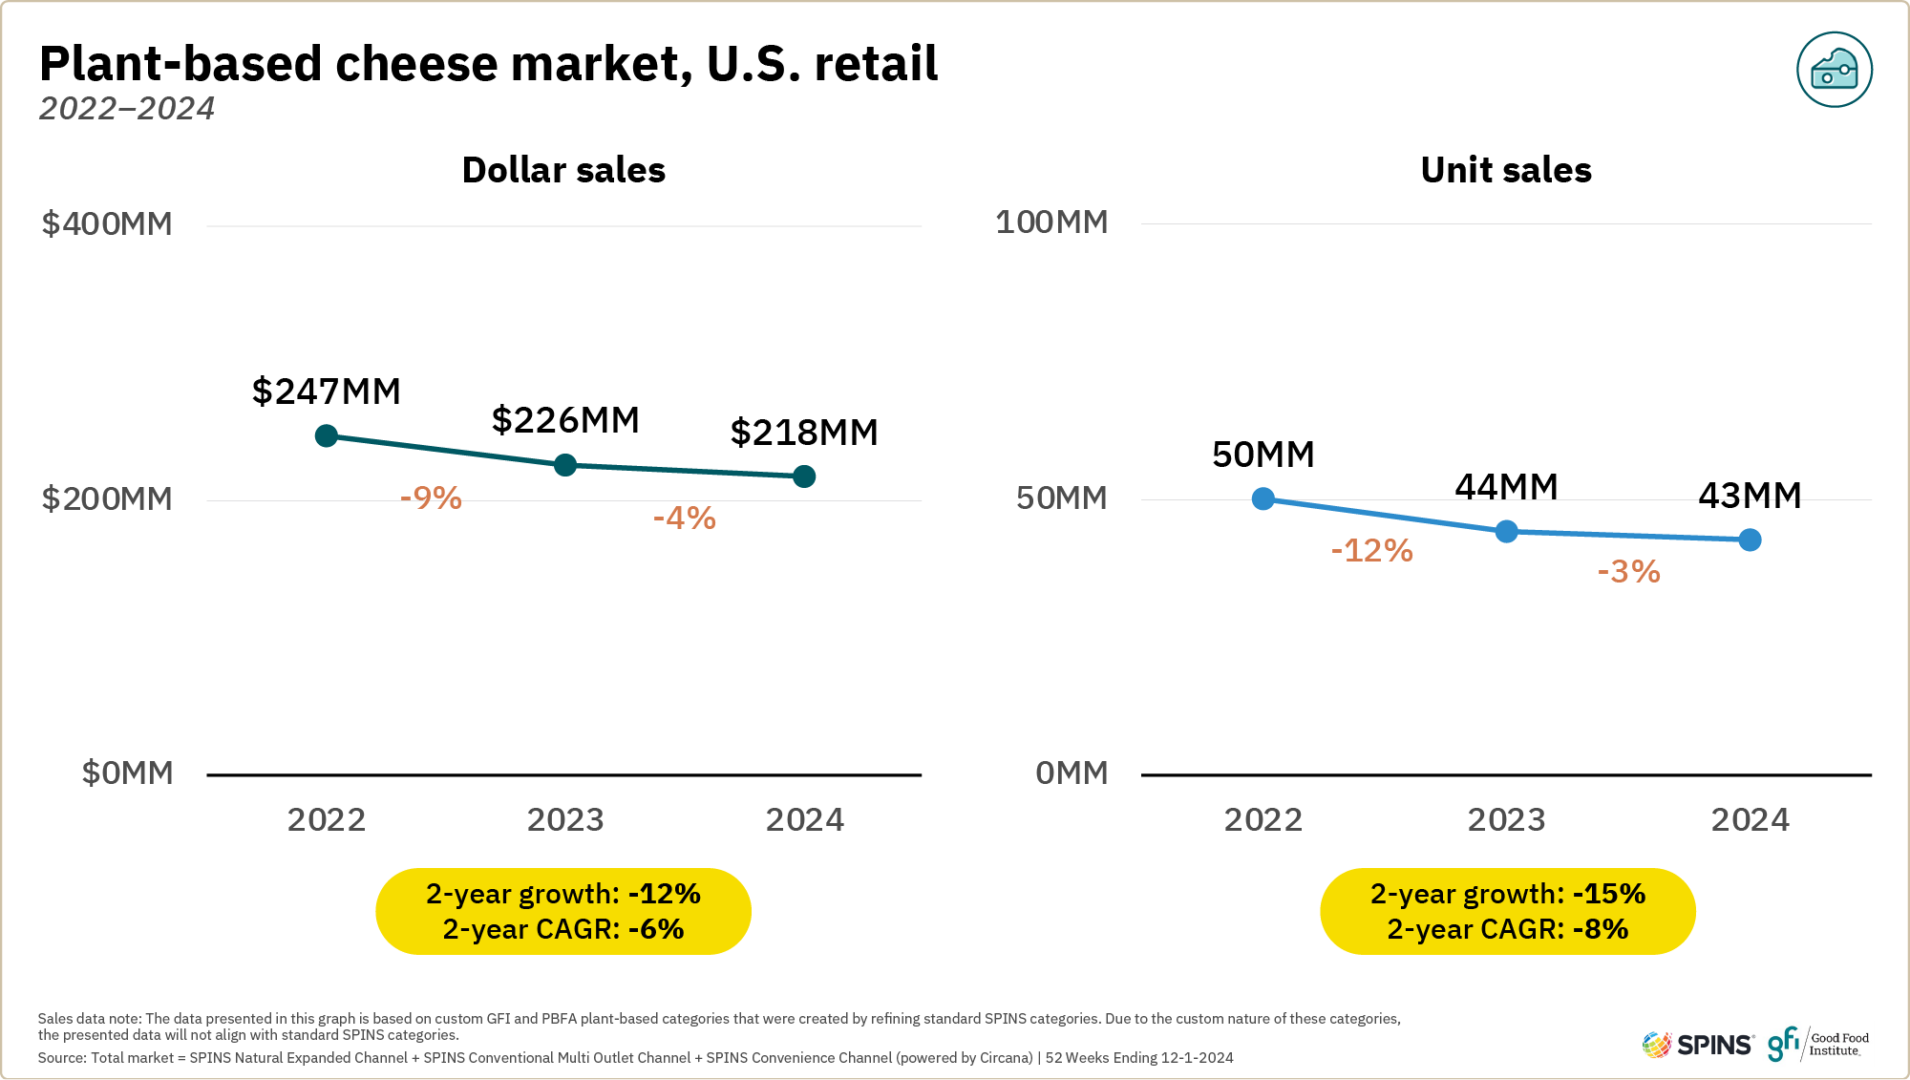
Both dollar and unit sales declined for the plant-based cheese category in 2024. However the rate of decline was slower than in 2023.
- Dollar and unit sales of plant-based cheese were down similar amounts. Dollar sales were down 4%, while unit sales were down 3%. Average retail prices were flat.
- Plant-based cheese’s dollar share of the total cheese market remained at about 1% over each of the last three years. Share is close to 6% in the natural channel.
- The animal-based cheese category has high consumer engagement, offering a large potential market. Behind only animal-based meat, animal-based cheese was the animal-based category with the greatest household penetration in the U.S., at 96%. Converting more of those households into plant-based cheese buyers represents a large opportunity for the plant-based cheese category.
- Household penetration of plant-based cheese declined slightly in 2024, but repeat rate improved. The percentage of households purchasing plant-based cheese was 4% in 2024 compared to 5% in 2023. However, the percentage of buyers purchasing in the plant-based cheese category more than once increased from 48% in 2023 to 54% in 2024, suggesting products are better meeting consumer needs.
- About half of plant-based cheese-purchasing households also purchased plant-based meat and seafood. Behind only plant-based eggs, plant-based cheese had the highest co-purchase rate of plant-based meat and seafood of any tracked plant-based category.
Ready-to-drink beverages
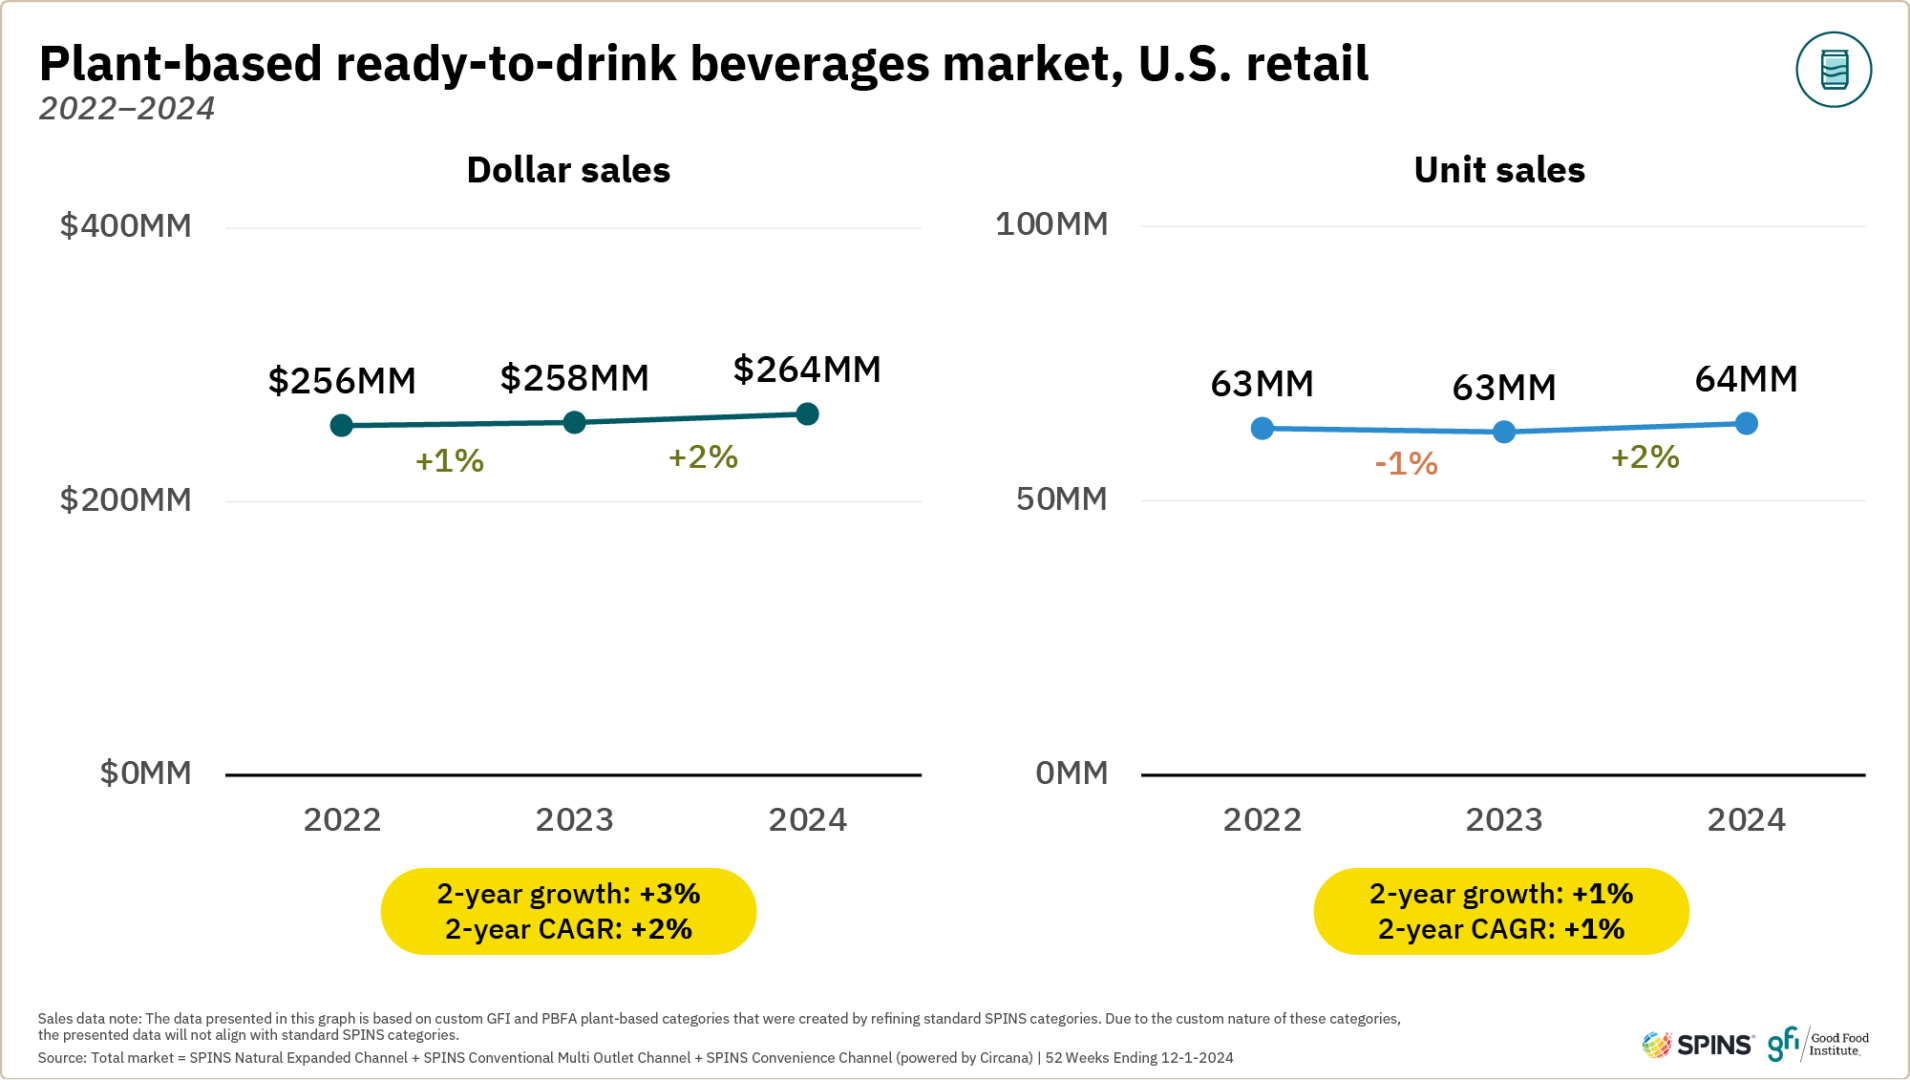
As several ready-to-drink beverage product types grow, consumers are seeking out plant-based options in the category. Plant-based replacements for ingredients like milk or creamer used in ready-to-drink lattes, nitro coffee brews, and teas are examples of the plant-based trend intersecting with an uptick in consumer interest in ready-to-drink beverages. The category experienced modest dollar and unit sales gains in 2024.
Cream cheese, sour cream, and spreads
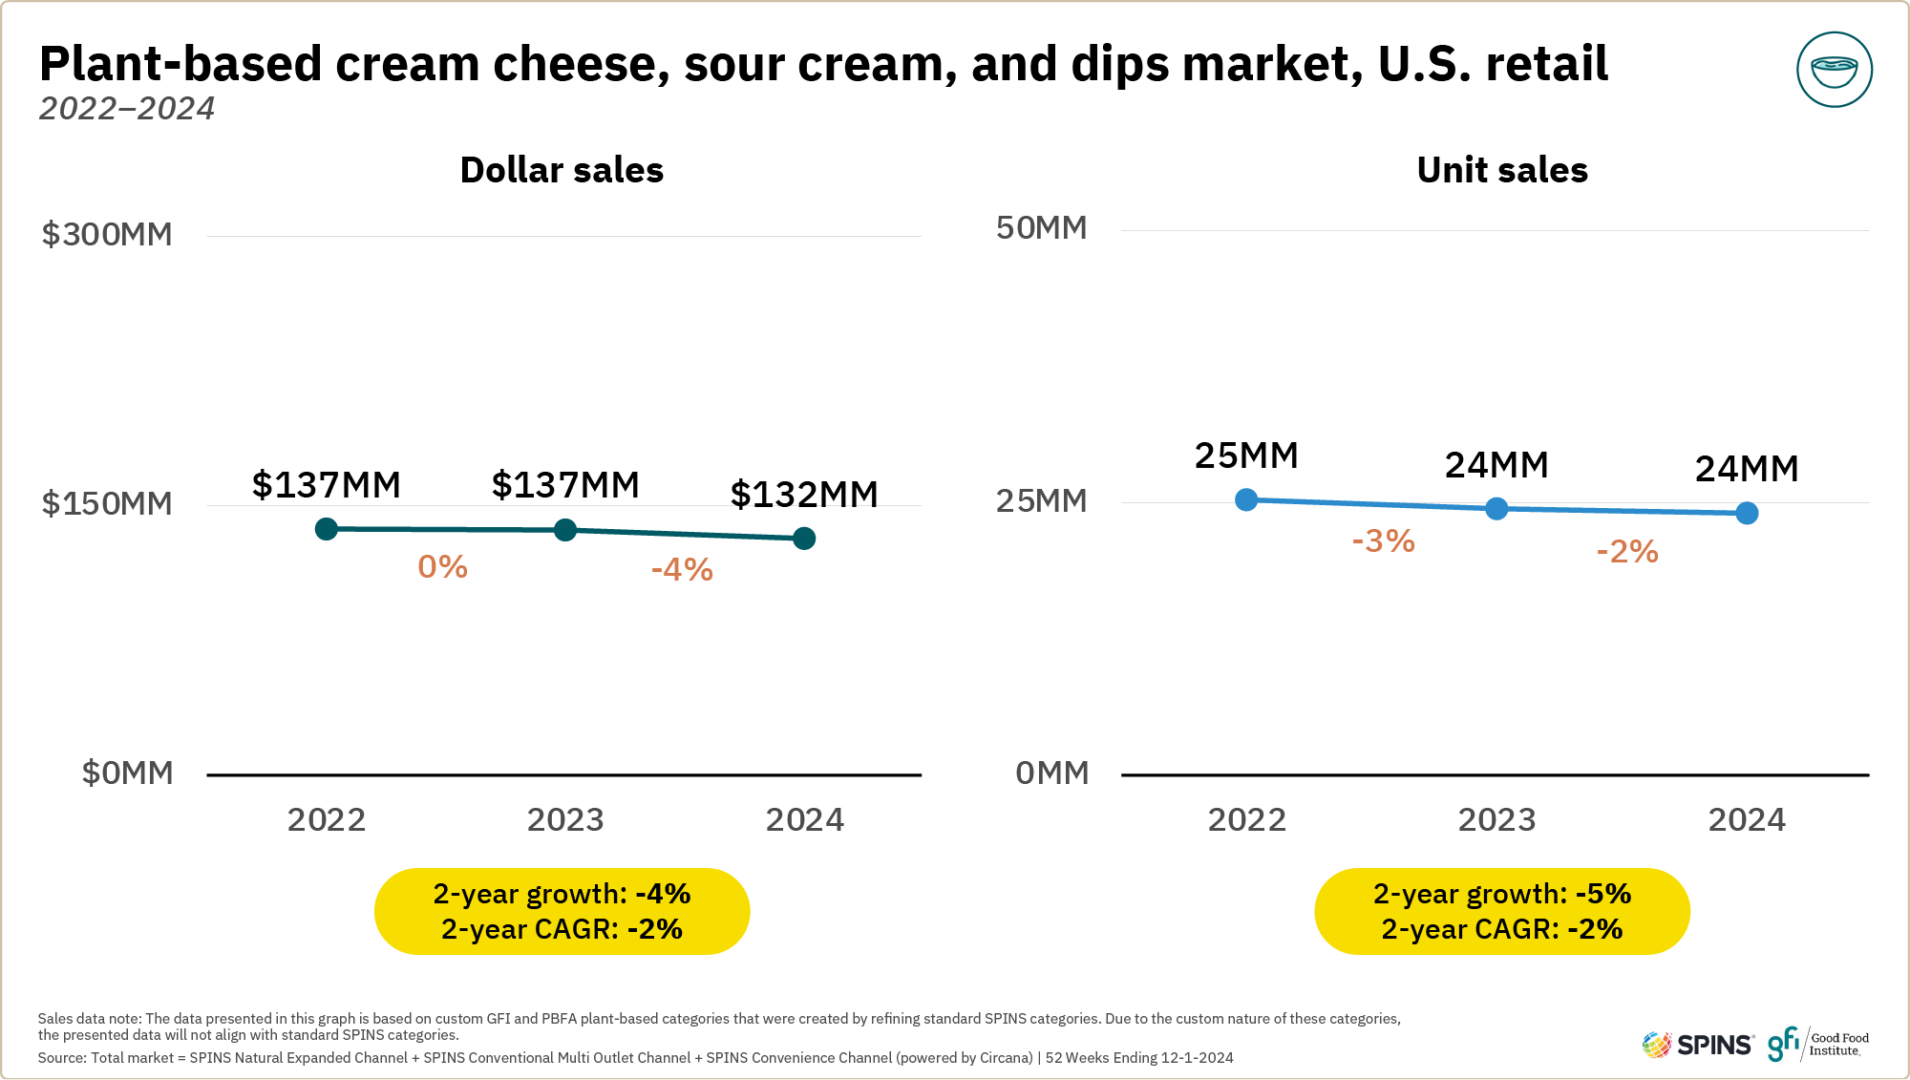
Plant-based cream cheese, sour cream, and dips saw modest sales declines in 2024.
Eggs
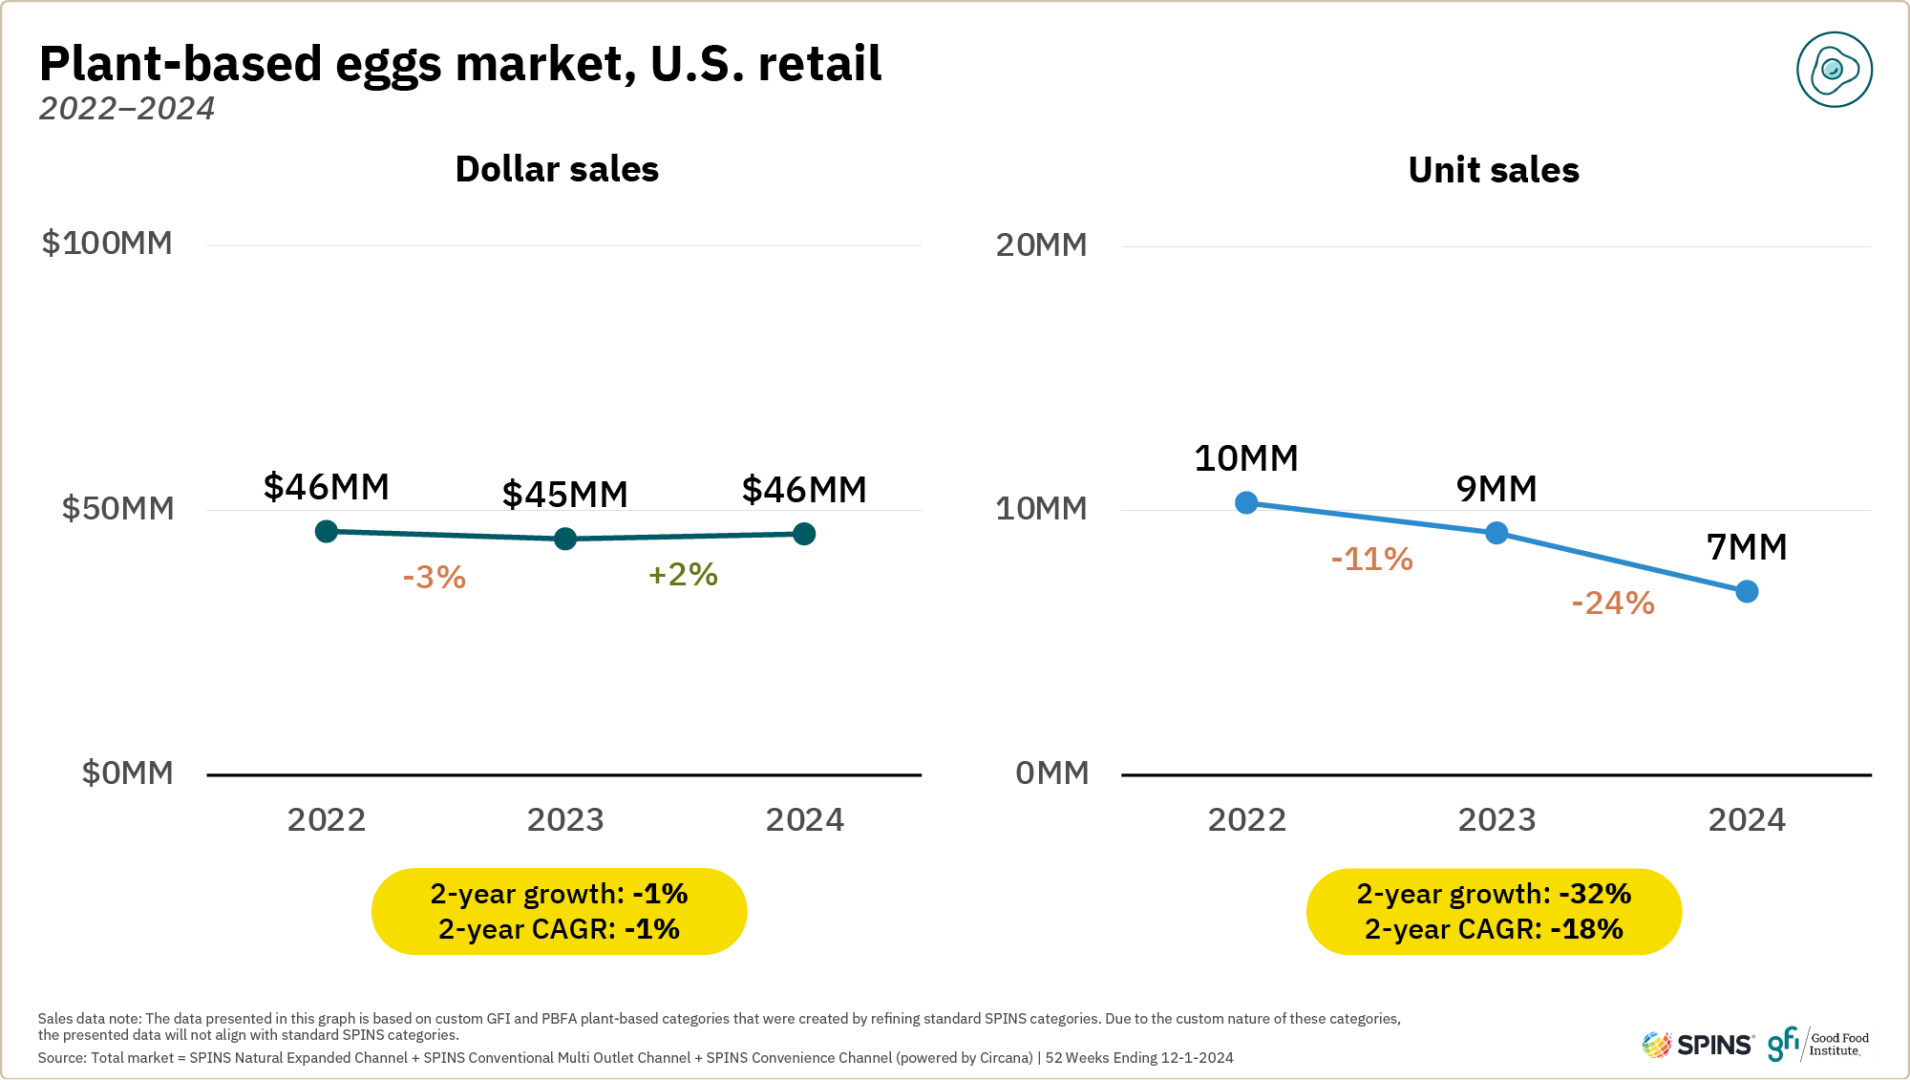
The plant-based egg category encompasses a range of products including liquid, folded, and hard-boiled egg substitutes as well as powdered egg replacements. Liquid plant-based eggs account for over 70 percent of dollar sales in the category.
The plant-based egg category experienced modest dollar sales growth in 2024. Significant unit sales declines were driven by the leading product in the category shifting to a larger package size (at a comparably higher price point).
- Very few households currently purchase plant-based eggs. Just 1% of households purchased these products in 2024, leaving a massive growth opportunity if more consumers can be reached.
- Repeat rates continue to increase. Growing from roughly 44% in 2022 to 56% in 2024, consumers are coming back to the plant-based eggs category at an increasing rate.
- Households purchasing plant-based eggs purchase other plant-based categories at the highest rate. For example, 71% of these households also purchased plant-based meat and seafood in 2024, versus 13% of total households. 77% purchased plant-based milk, versus 40% of total households.
- Plant-based egg buyers may skew slightly older than buyers of other plant-based categories. Gen X households were more likely to buy and spend more on plant-based eggs in 2024 (whereas Millennials tended to overindex for many other plant-based categories).
- Animal-based eggs experienced sales increases in 2024 driven by price. Conventional eggs saw unit sales grow 1% and dollar sales grow 11% as average retail prices increased significantly. Price was heavily impacted by increasing rates of highly pathogenic avian influenza (HPAI).
- The price gap persisted in 2024. While conventional egg prices increased in 2024, so too did plant-based egg prices. The price gap remained close to $5 per dozen (note: for plant-based eggs we use egg “equivalent” information from product packages to equate to a dozen eggs).
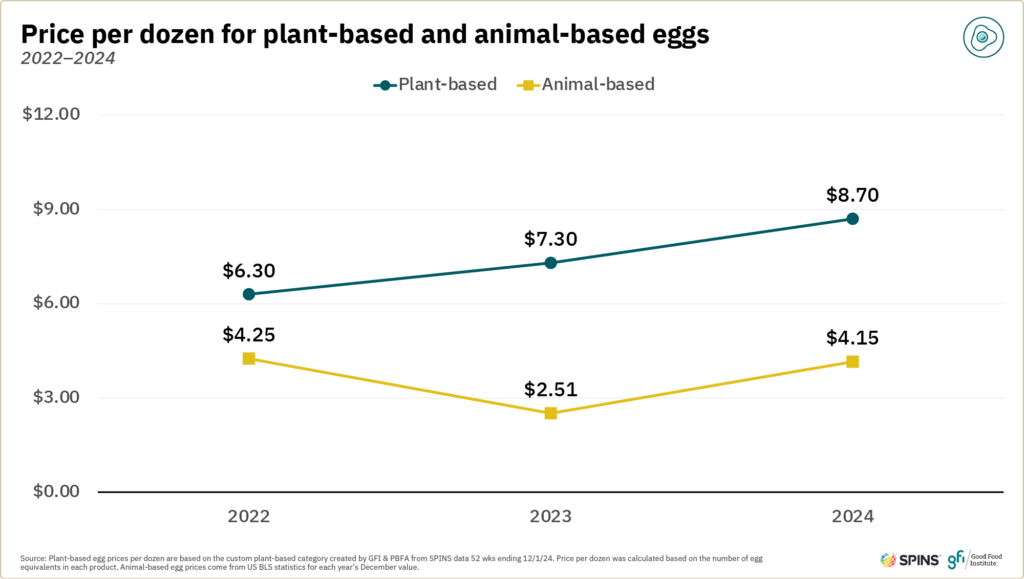
Note: Plant-based eggs are not sold per dozen (or count) like conventional eggs, but rather can be tracked by weight in ounces or egg “equivalents.” To estimate a price per dozen for plant-based egg products, we used the stated number of egg “equivalents” from each product package. This differs from previous years, when we used a simplified methodology assuming 24 ounces was equivalent to a dozen eggs. This approach works well for liquid plant-based egg products, but underestimates equivalency for powdered products.

Other plant-based foods
Additional plant-based food categories such as prepared meals; protein liquids and powders; bars; tofu, tempeh, and seitan; condiments and dressings; and baked goods and other desserts provide additional options to consumers seeking more ways to add plant-based foods to their diets.
photo credit: Mind Blown
Plant-based meals
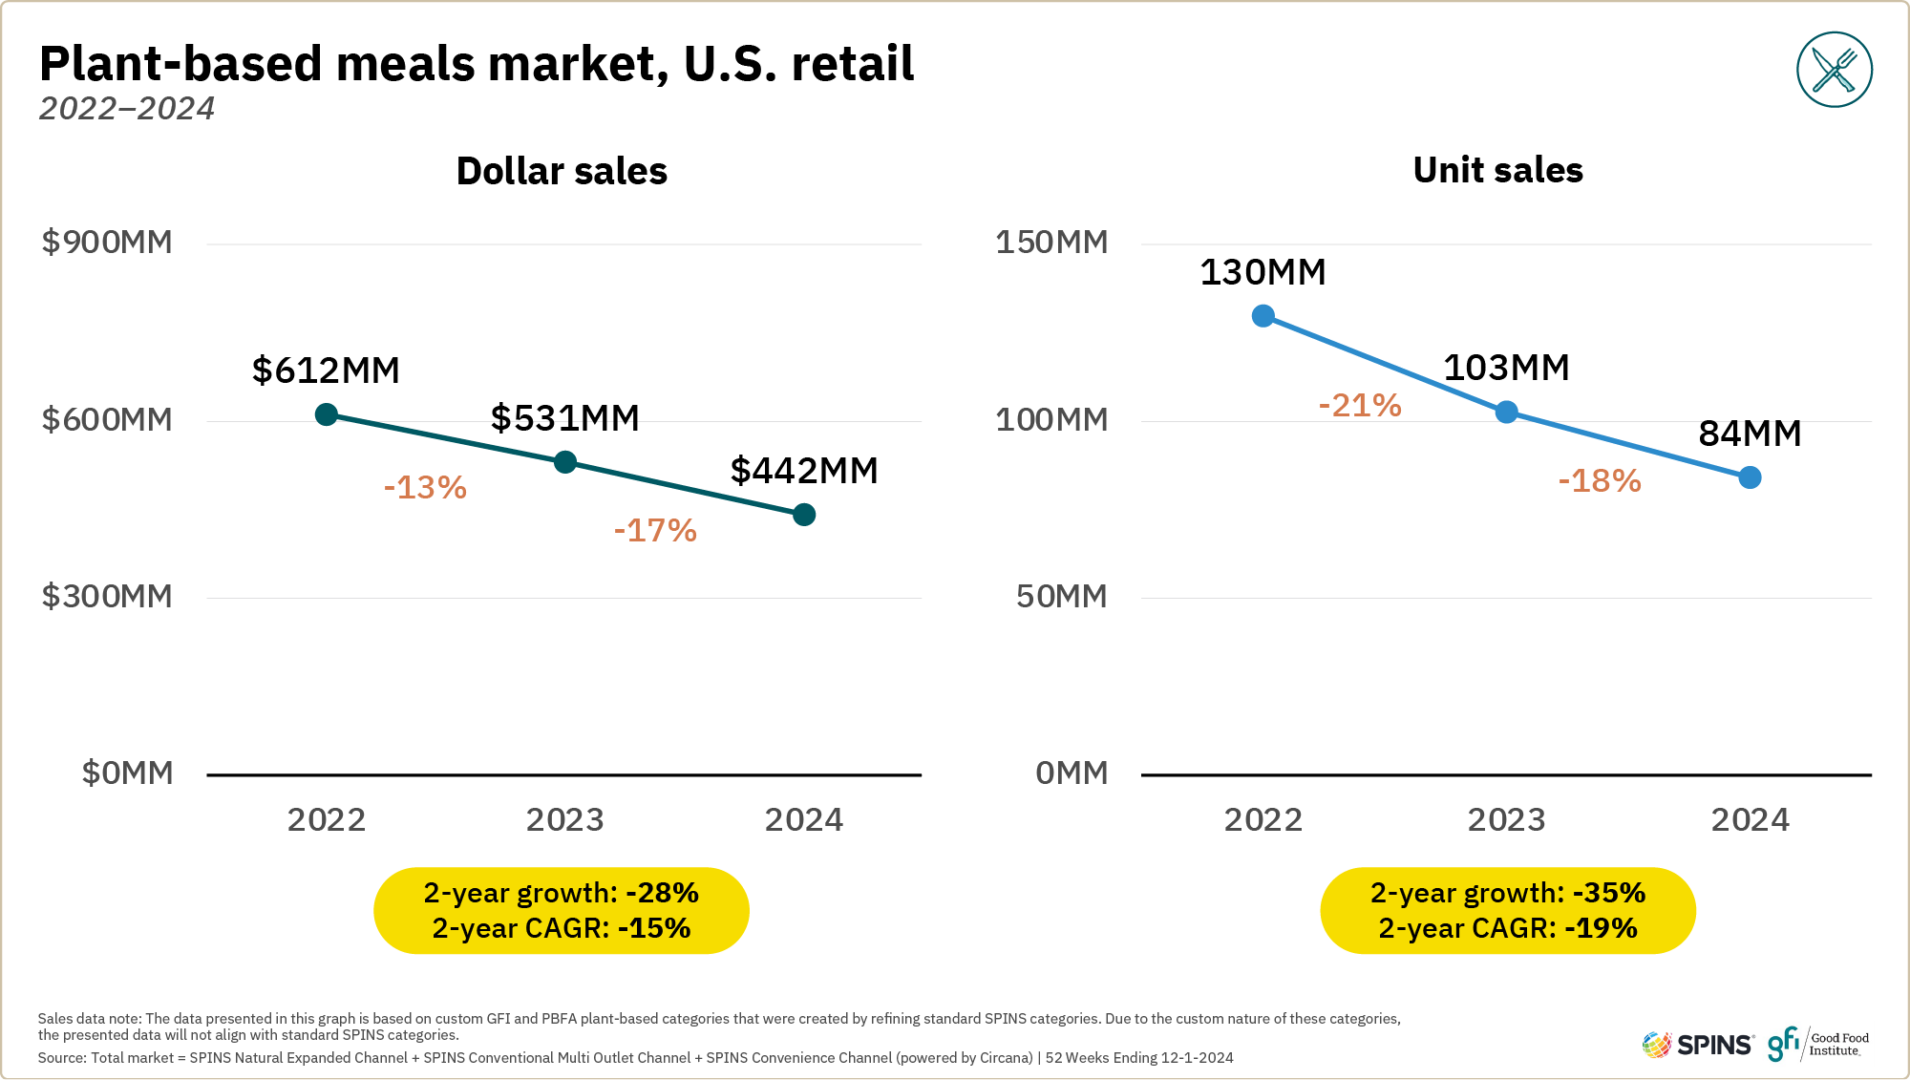
The plant-based meals category saw continued dollar and unit sales declines in 2024. Incorporating plant-based meat and seafood, egg, and dairy ingredients into ready-to-eat meals is an important prong of providing customers with convenient meal solutions that meet their needs.
Plant-based protein liquids and powders
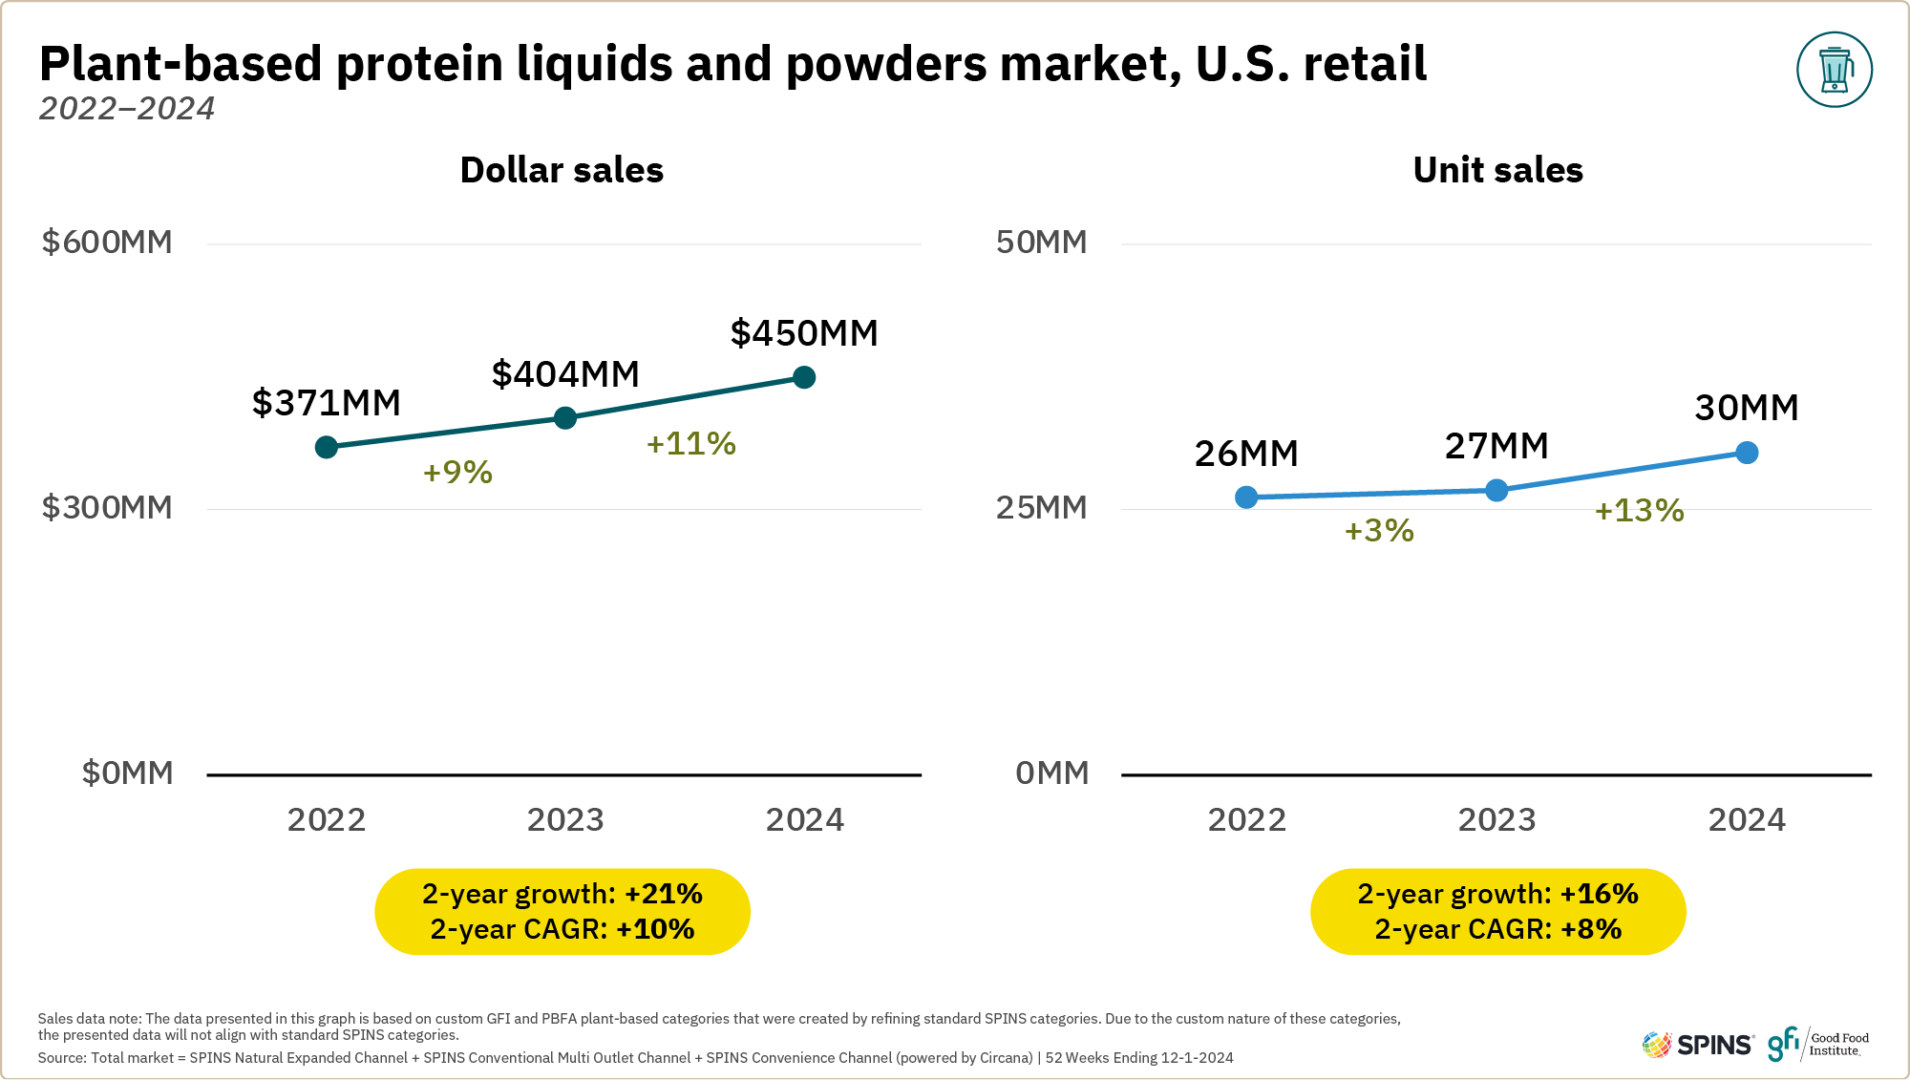
A bright spot in the plant-based segment, protein liquids and powders experienced accelerating unit and dollar sales growth in 2024, driven by gains in both distribution and velocity. Plant protein is seizing the moment as consumers turn towards better-for-you products and look to add protein to their diets. In the natural channel, this category made up an impressive 38% of all protein liquids and powders sales, the highest natural channel share of any plant-based category we track.
Plant-based protein bars
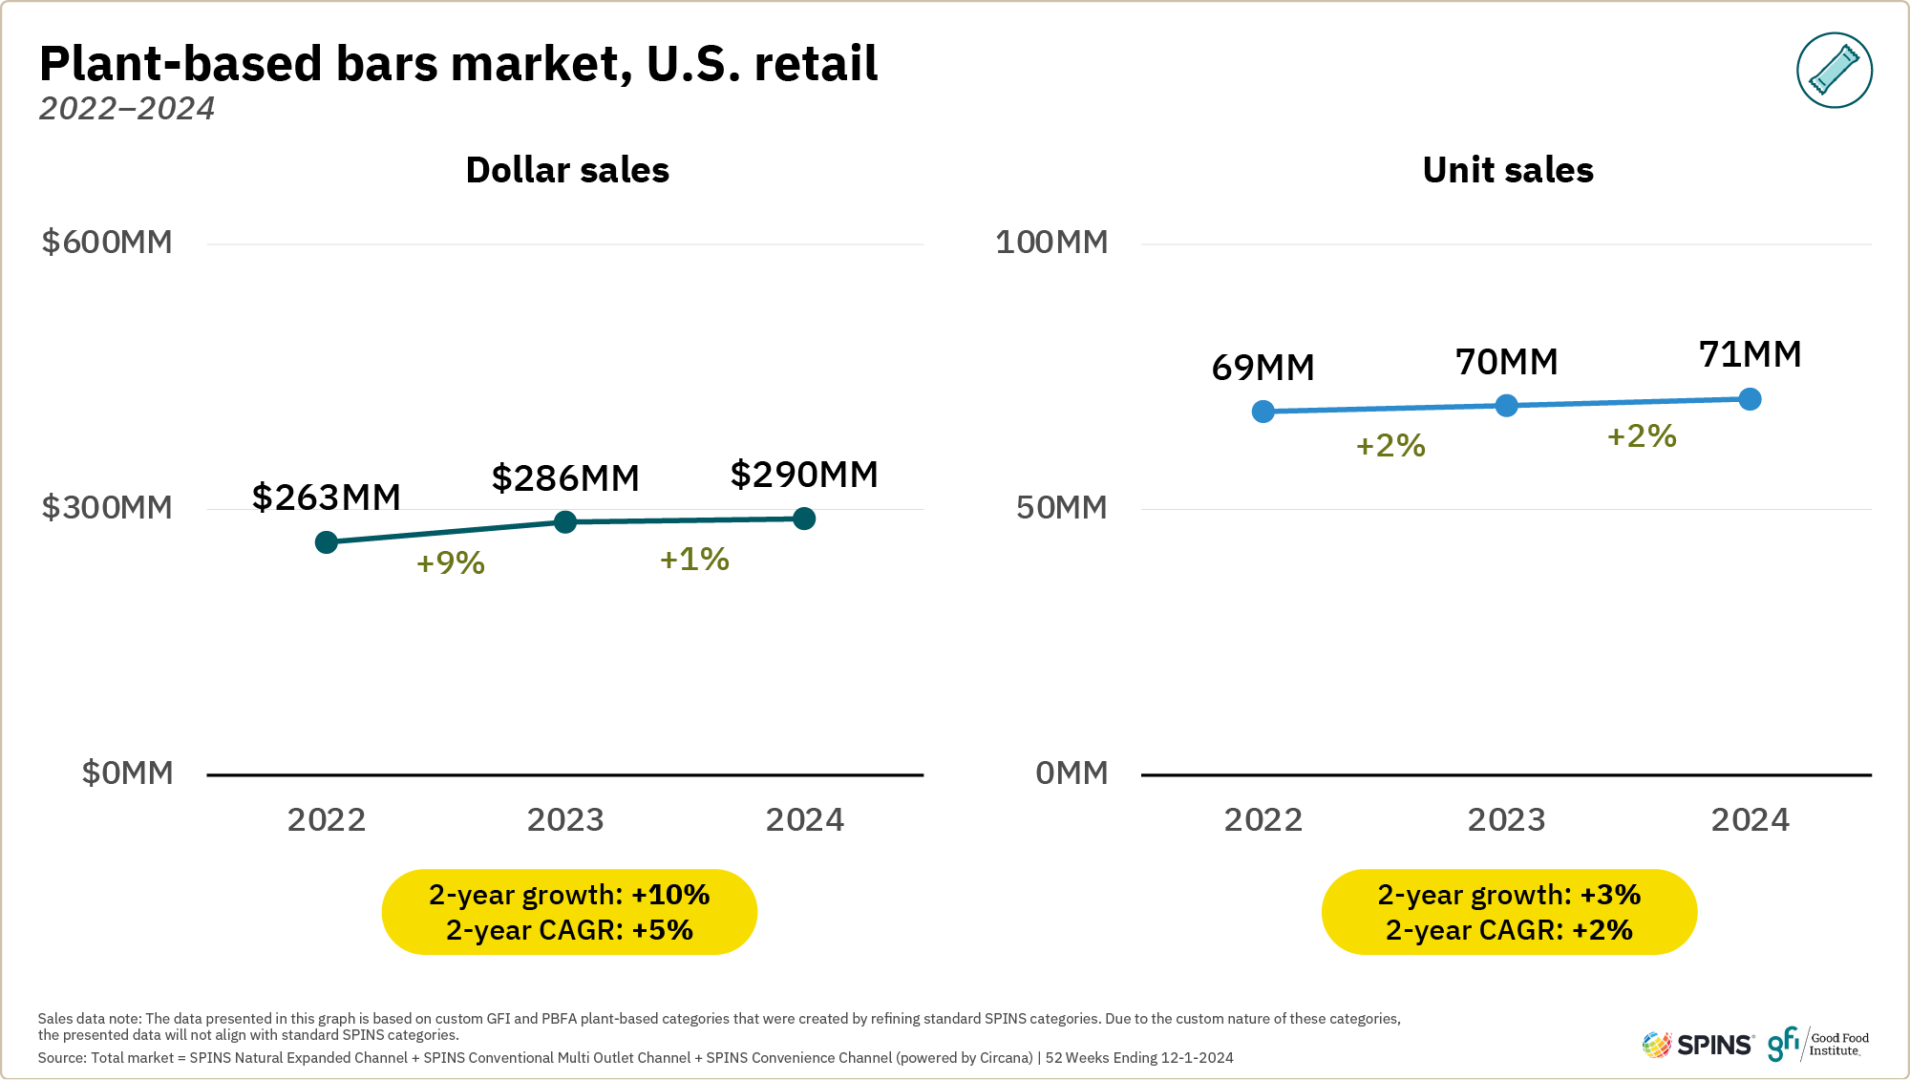
Plant-based bars experienced modest dollar and unit sales increases in 2024. Similar to plant-based protein liquids and powders, these products are well-positioned to capture growing consumer demand for convenient protein sources.
Tofu, tempeh, and seitan
The tofu, tempeh, and seitan category performed relatively well in 2024 compared to other plant-based protein categories. Both dollar and unit sales grew while prices held relatively steady. Growth was even stronger in the natural channel where dollar sales were up 12 percent, and unit sales were up eight percent.
Condiments and dressings
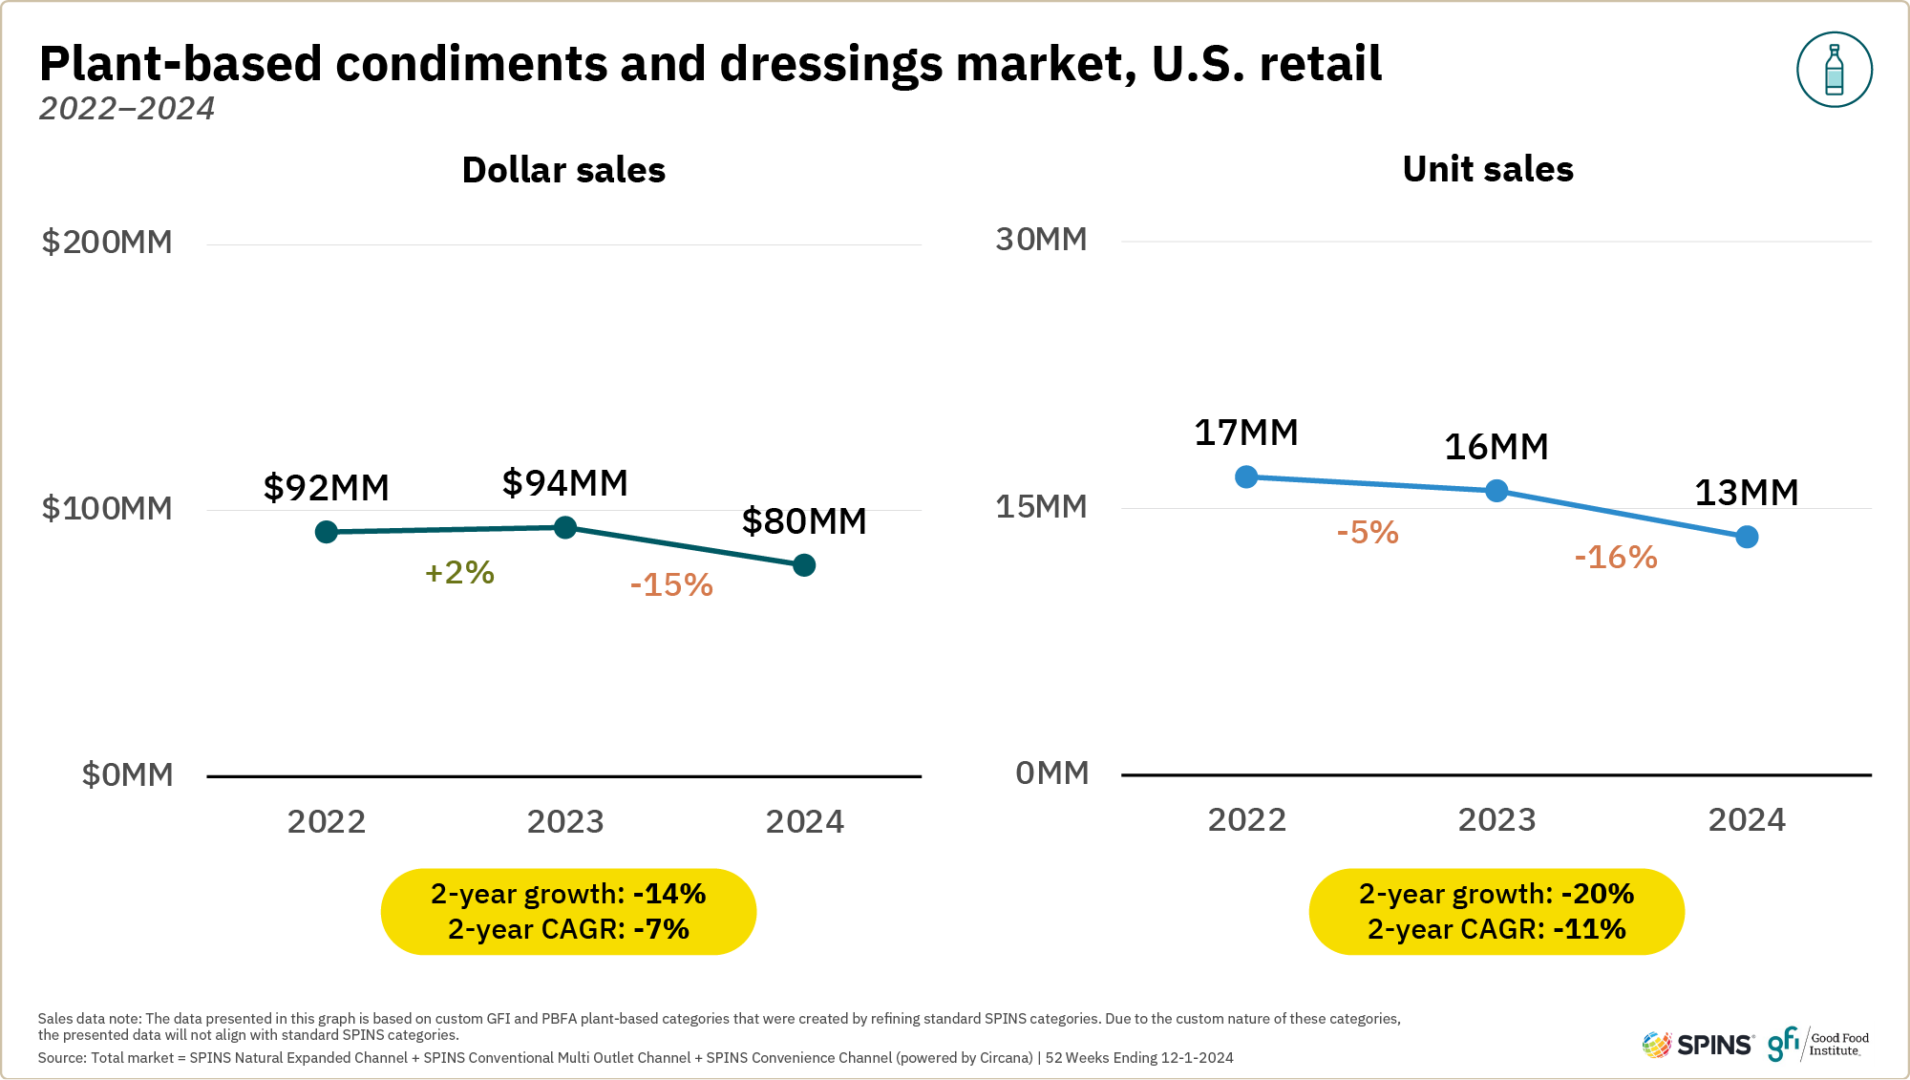
Plant-based condiments and dressings experienced significant sales declines in 2024. A large portion of this decline can be attributed to a small number of products that made adjustments to product formulas and/or branding in 2024 that may need further optimization to align with consumer demand.
Baked goods and other desserts
Plant-based baked goods and other desserts were a highlight of 2024, with accelerating unit and dollar sales growth.
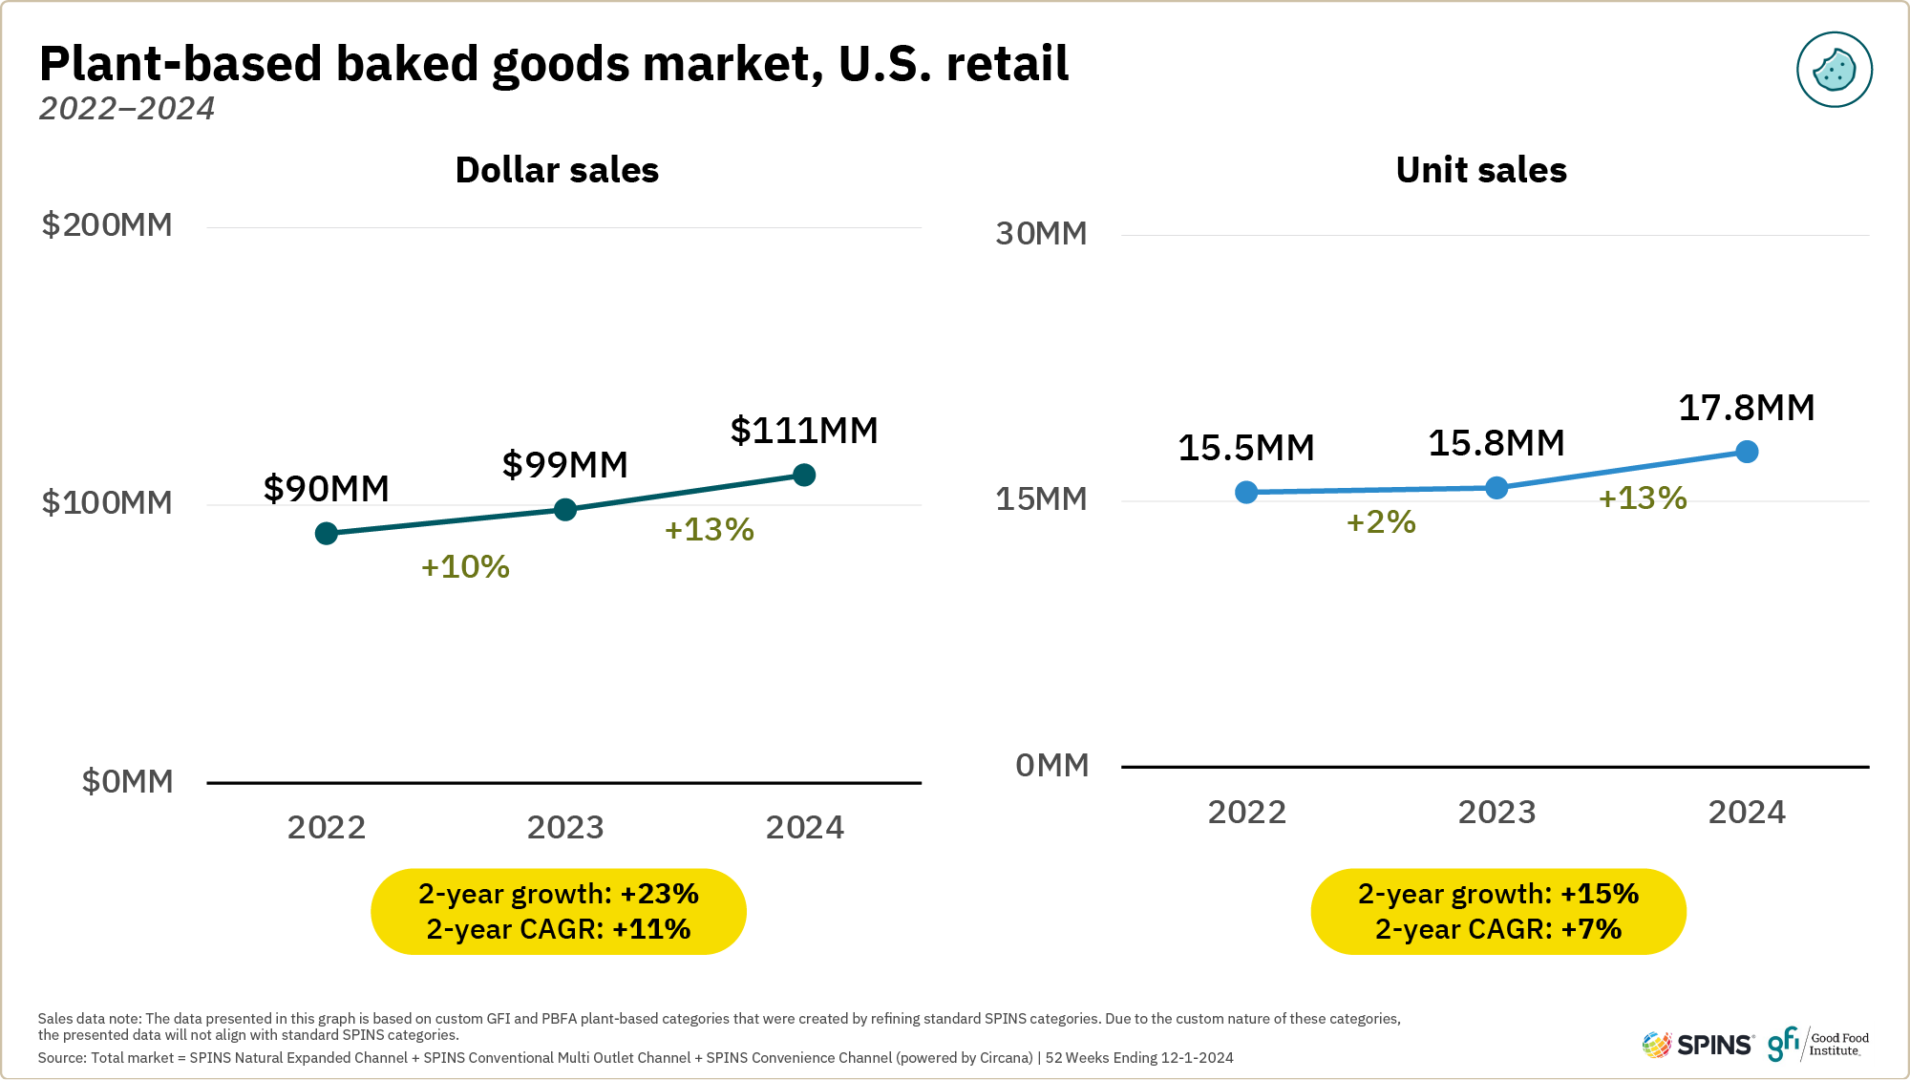
Note: The plant-based baked goods and other desserts category was constructed by compiling vegan-coded items held within the SPINS’ shelf stable Baked Goods subcategory as well as plant-based positioned frozen and refrigerated pies, baked goods, pastries, doughs, and other desserts.
About the data
Point-of-sale data
To size the U.S. retail market for plant-based foods, GFI and PBFA commissioned retail sales data from the market research firm SPINS. The firm built the dataset by first pulling in all products with the SPINS “plant-based positioned” product attribute. The dataset was further edited by adding plant-based private-label products. Inherently plant-based foods, such as chickpeas and kale, are not included. Due to the custom nature of these categories, the retail data presented may not align with standard SPINS categories. Additionally, SPINS pulled in relevant mainstream subcategories (excluding plant-based positioned products) in order to create the “Conventional” categories discussed. Finally, the total food and beverage category was pulled bringing in all grocery, frozen, and refrigerated edible items across the retail grocery landscape as well as protein powders and bars. SPINS obtained the data over the 52-week, 104-week, and 156-week periods ending December 1, 2024, from the SPINS Natural Expanded Channel and SPINS Conventional Multi-Outlet and Convenience Channels (powered by Circana).
SPINS defines these channels as follows:
- Conventional Multi Outlet (MULO) Channel: More than 110,000 retail locations (powered by Circana) that cover the Grocery Outlet (stores with $2M+ annual ACV), the Drug Outlet (chains and independent stores, excluding Rx sales), and selected retailers across Mass Merchandisers (e.g., Walmart, Target), Club (e.g., Sam’s Club), Dollar, all Military, and Amazon F3 (Fresh, Prime Now, Go).
- Natural Expanded Channel: More than 2,500 full-format stores with over $2 million in annual sales and 30% or more of UPC coded sales from the Health & Wellness Industry (HWI) and 15% or more from the Natural Product Industry (NPI) Product Universes.
- Convenience Channel: More than 150,000 convenience locations (powered by Circana) that are less than 5,000 square feet, have extended hours, stock at least 500 SKUs, and provide a mix of grocery items like beverages, snacks and confections, and tobacco.
This is generally considered the broadest available view of retail food sales, although not all retailers are represented. Some companies do not report their scan data to Circana but are represented via projections. Please note that this study’s methodology has changed compared to that used in previous reporting by GFI. We do not recommend comparing data released in prior years to the data included here.
Consumer panel data
To understand consumer purchasing dynamics and demographics, GFI and PBFA also commissioned consumer panel data from SPINS. The process for pulling the panel data was separate from that for the POS data, which may result in minor category differences. SPINS combines Circana Scan Panel with proprietary Product Intelligence to provide a unique view into shopper incrementality, loyalty, cross-purchase, demographics, and more. SPINS obtained the data over the 52-week, 104-week, 156-week, and 208-week periods ending December 3, 2023, from all U.S. outlets.
About SPINS

SPINS connects shopper values to product innovation by combining POS data across conventional, eCommerce, and natural channels with deep product knowledge. By translating product data into attributes, we ensure retailers, brands, and their partners know just as much about the products they create, stock, and sell as the shoppers that buy them. These attributes create a common language that promotes collaboration and growth across the ecosystem.
Meet the authors


Emma Ignaszewski
DIRECTOR OF CORPORATE ENGAGEMENT
Emma Ignaszewski oversees the corporate engagement team’s direct outreach group. We champion alternative protein adoption by the food industry, including manufacturers, retailers, restaurants, investors, and more. We share research and insights to educate the public on opportunities in alternative proteins and engage with stakeholders across the entire innovation-to-impact pipeline.

Support our work
Our industry engagement is made possible thanks to our generous, global family of donors. Philanthropic support is vital to our mission. Connect with us today to discuss how you can help fuel this transformative work.
Related resources
Have questions?
Get in touch!
